An earth grid that is properly designed will safely dissipate current into the ground
During typical earth fault conditions, the flow of current to the earth will produce voltage gradients within and around a substation.
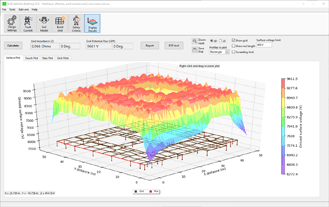
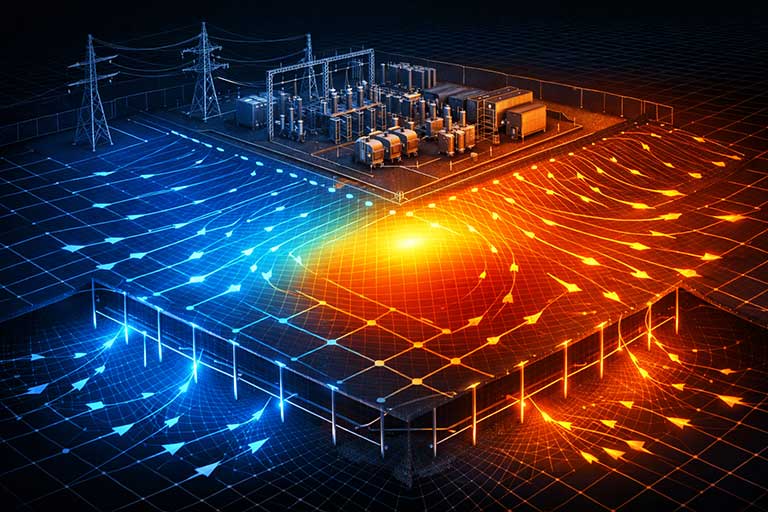
The image below shows the ground surface voltages during a 50/60 Hz earth fault for a 110 kV AIS/GIS substation earth grid buried within a soil resistivity structure which has multilayers.
The following plots demonstrate the behaviour of the grid conductors (in terms of currents distribution and voltage rise) as the fault energy is dissipated into the surrounding soil.
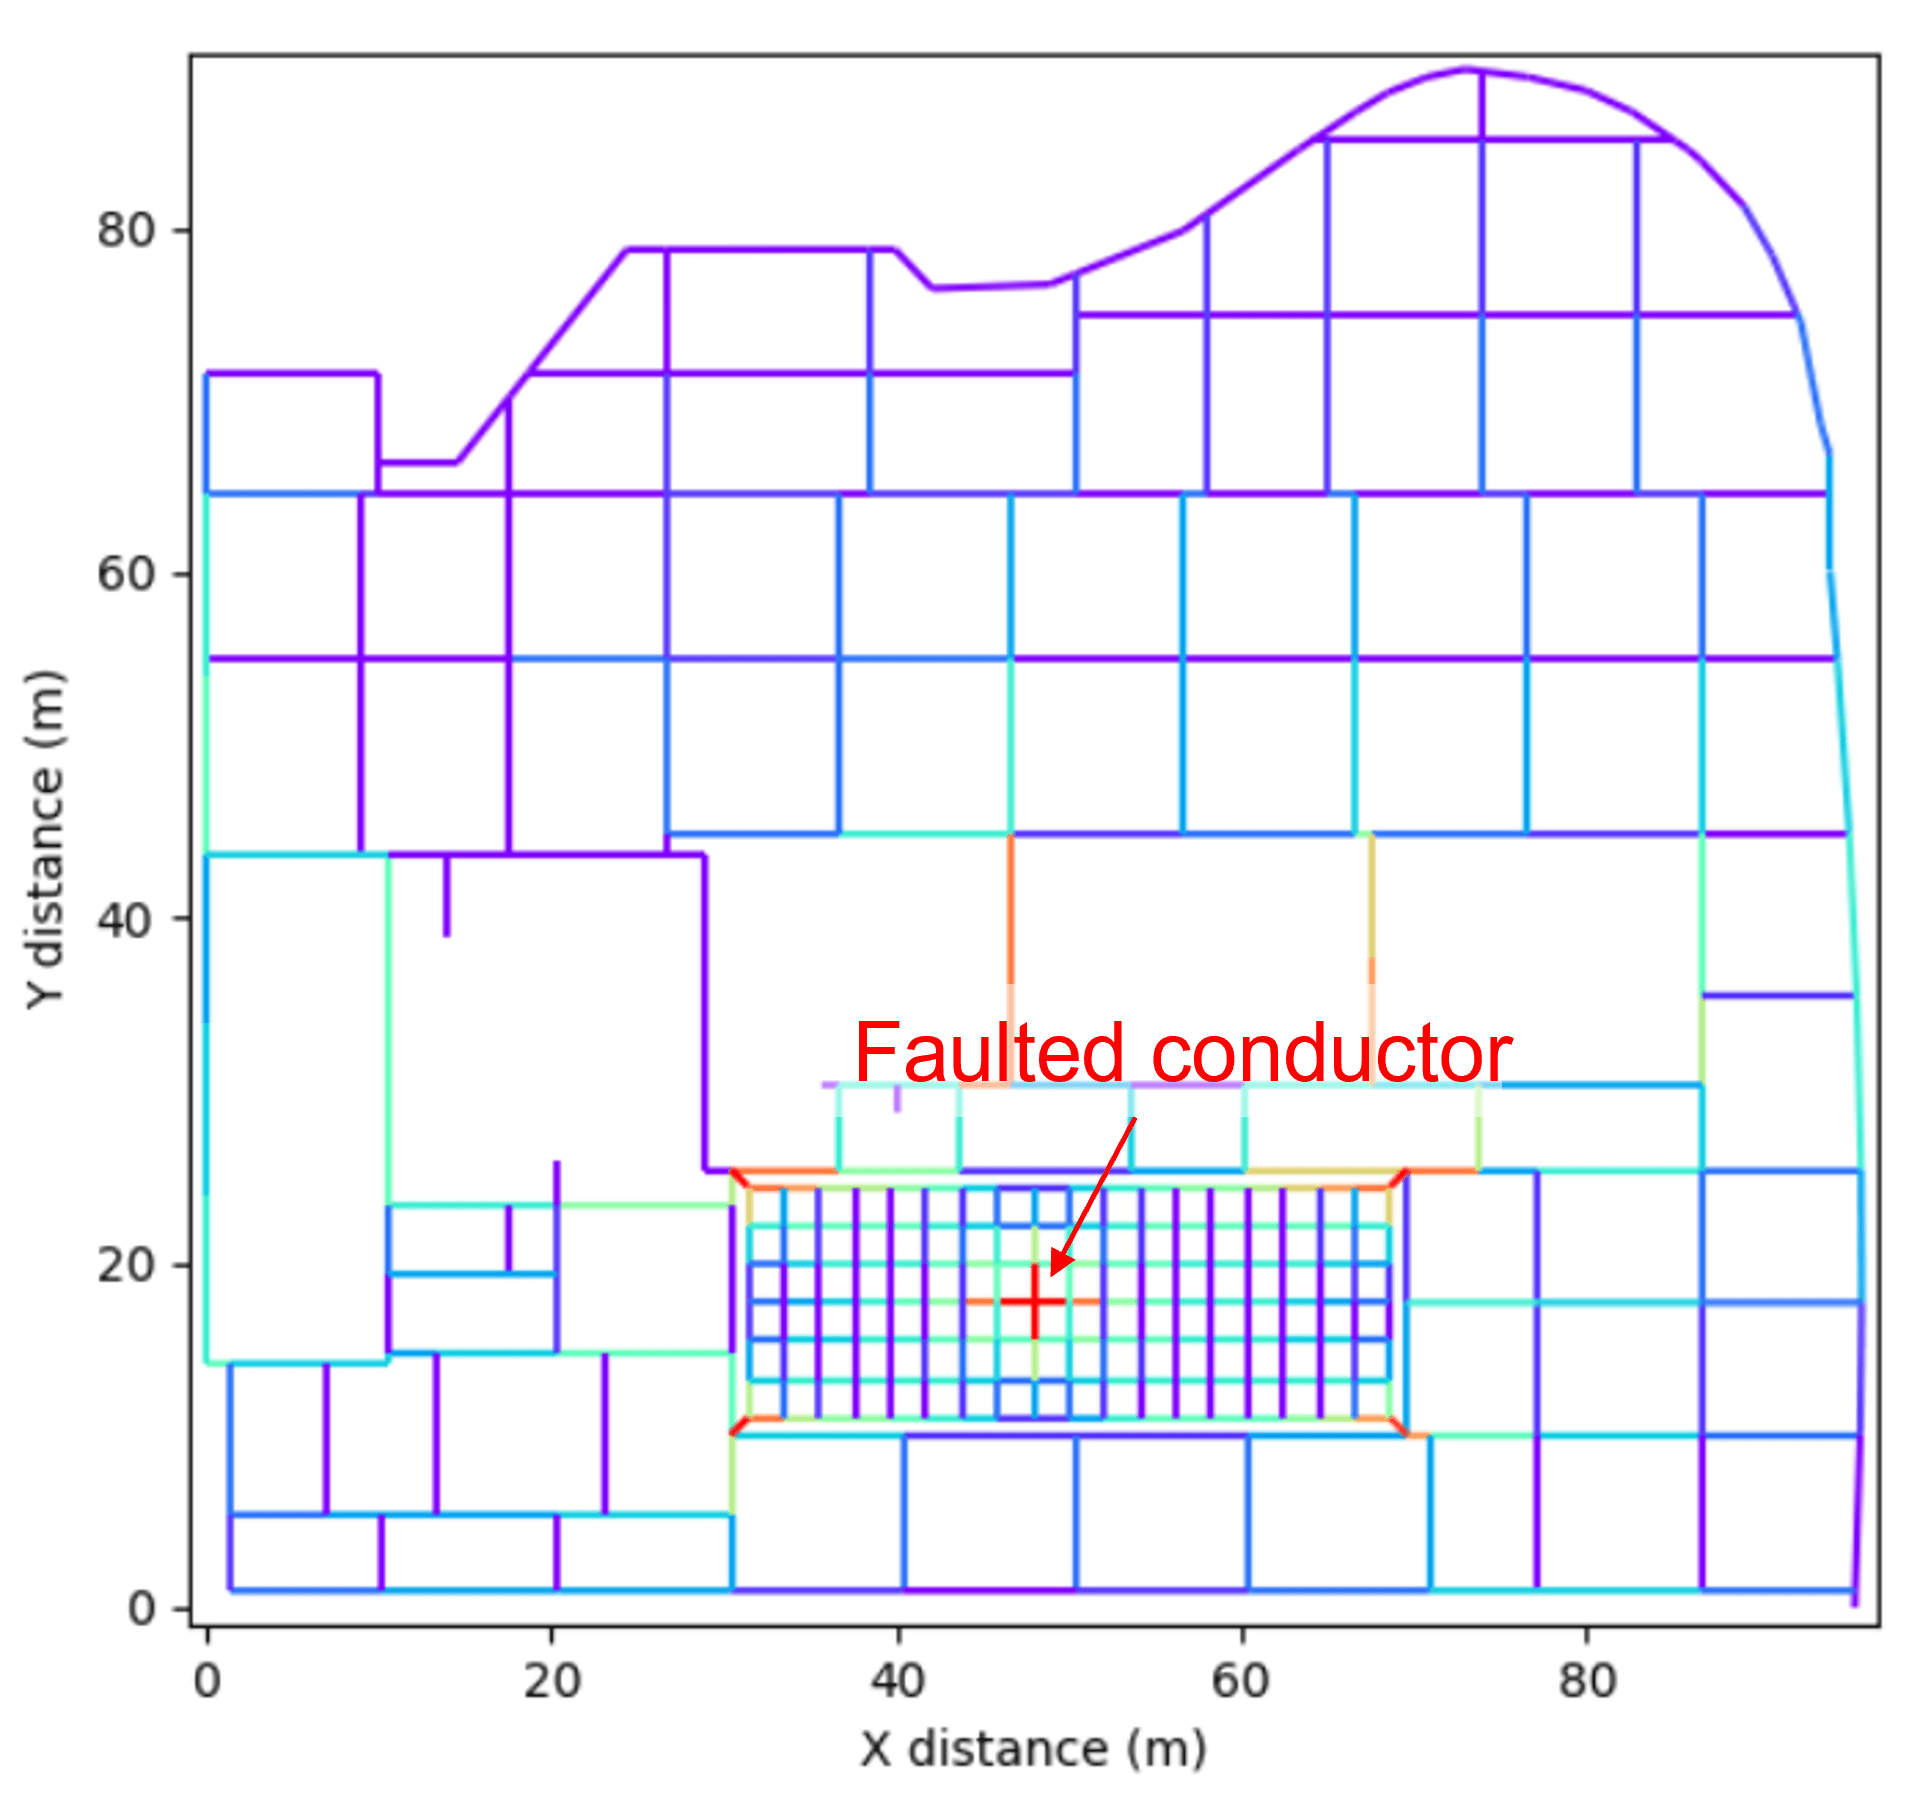
The plot here shows the magnitudes of the currents travelling along each grid conductor. The hot colours (where red colour is the hottest) indicates high current magnitude.
The total fault current enters the earth grid at the faulted conductor in the GIS building (centre of the plot). The fault current divides as it travels through the grid conductor network.
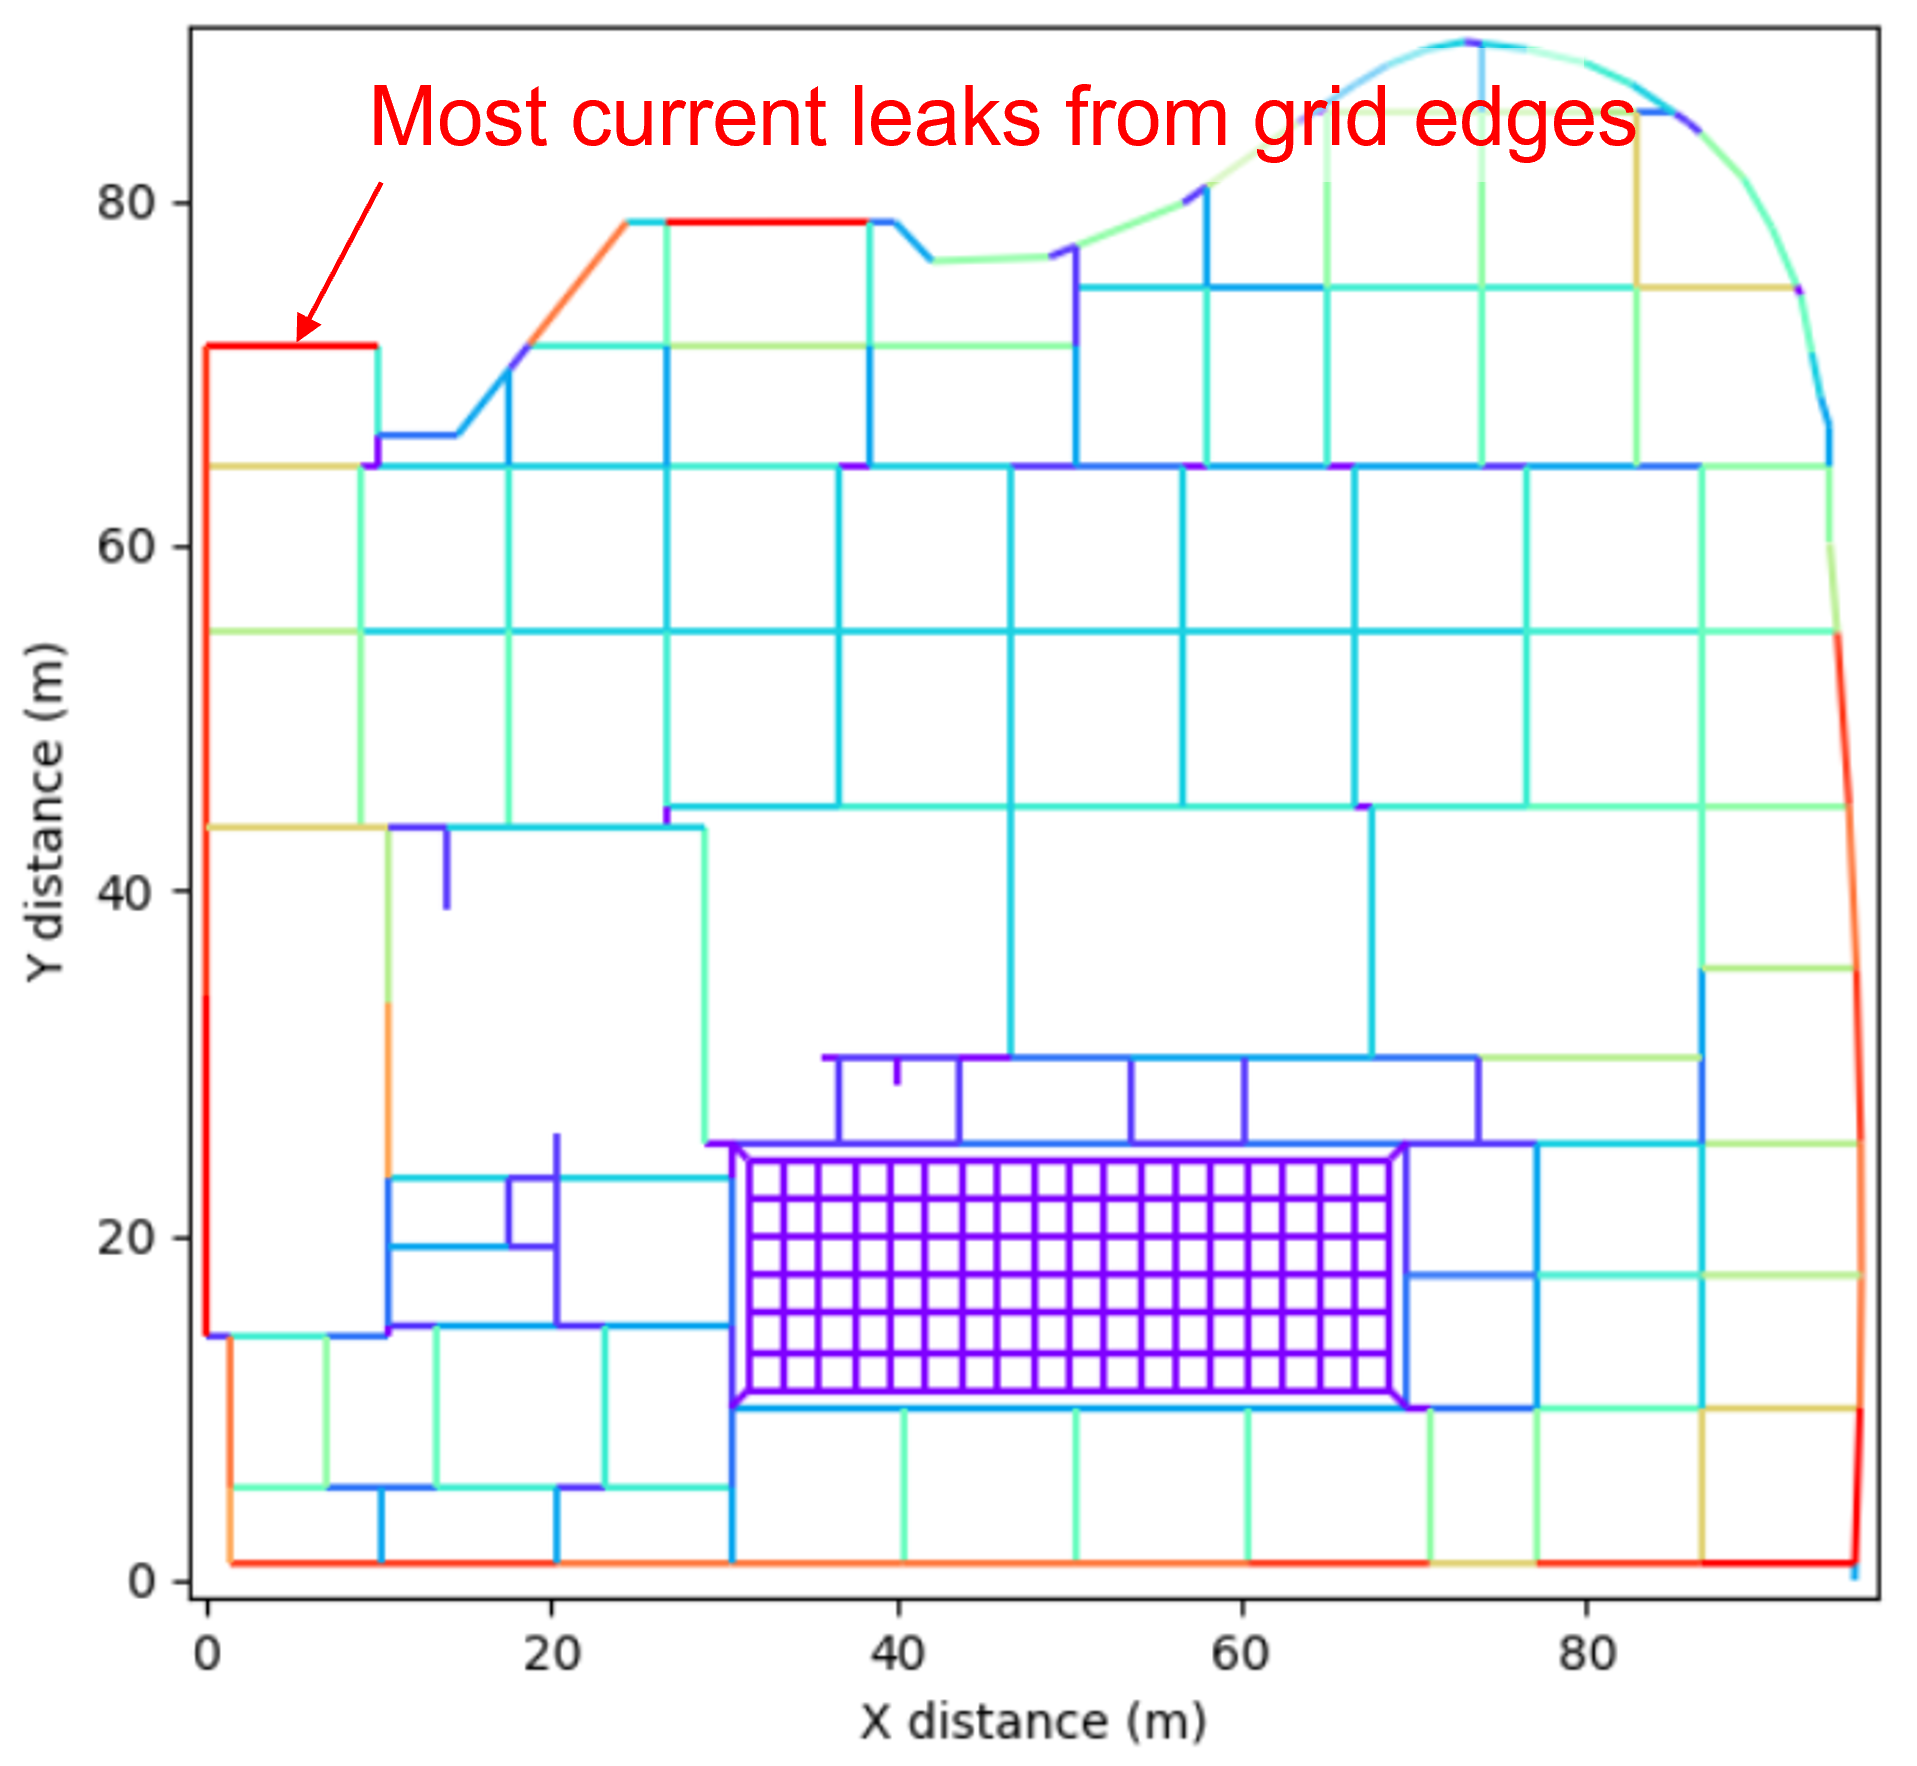
Leakage currents
This plot shows the currents leaking out of conductors into the surrounding soil.
Most of the fault current is dissipated into the soil along the perimeter conductors. This is one reason why the highest touch voltage hazards are often seen at the grid perimeters.
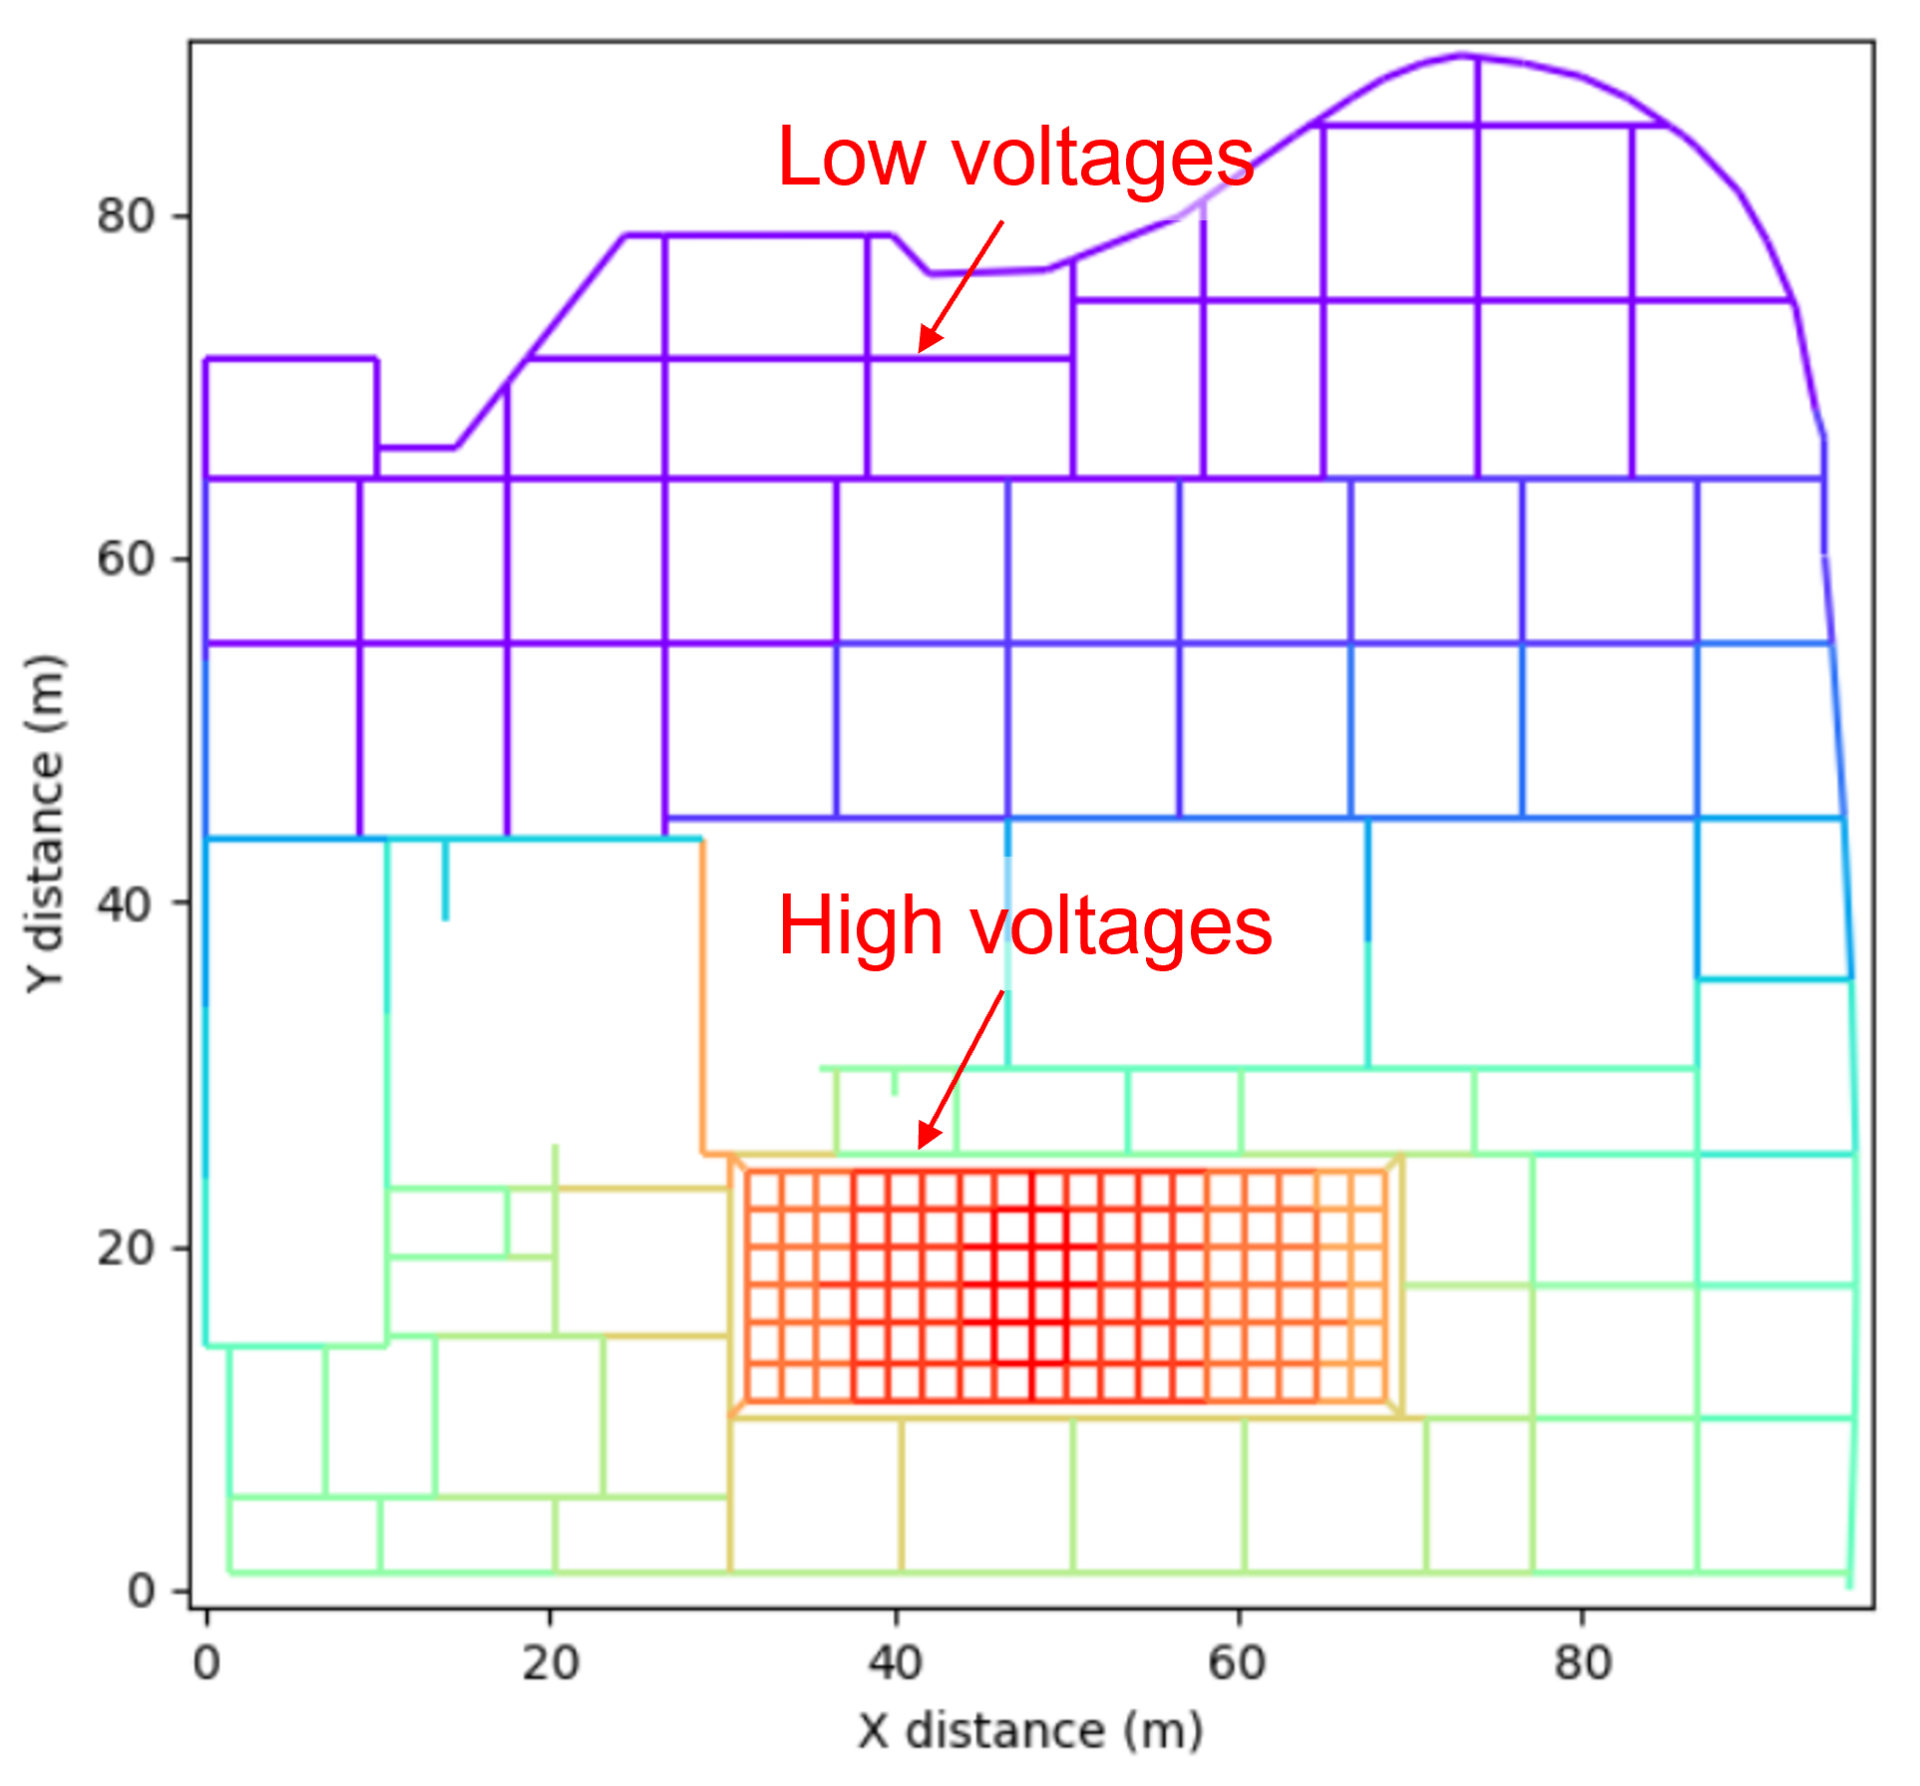
Segment voltages
This plot shows the voltage magnitude of the grid conductors.
As expected, the highest voltages are seen at the conductors nearest to the fault location (injection point). There is a voltage drop across each of the conductors which reduces the voltages of conductors that are farther from the injection point.
The calculations and the plots were produced using ELEK SafeGrid Earthing Software.
SafeGrid Earthing Software
Easily design safe earthing systems in compliance with Standards.
Comparison of the best earthing and grounding system design software including ELEK SafeGrid, CDEGS, XGSLab, ETAP and more based on technical features and compares price.
The IEC 60479-1 Conversion Factor sets how body impedance translates into permissible touch voltage. See how 70%, 80% and 90% values change your design.
Compare CDEGS vs ELEK SafeGrid for earthing design software. See differences in features, soil modelling, safety calculations, accuracy, and usability for substation earthing design.