Table of Contents
Grounding Design on Large Sites with Changing Soil Conditions
Large grounding grids used in solar farms and transmission substations often extend several hundred metres across a site. At this scale, soil resistivity rarely remains uniform across the entire footprint.
Grounding studies typically use multilayer soil models derived from resistivity testing. These models assume soil properties vary with depth but remain consistent horizontally. Where soil conditions change across the site, that assumption does not represent actual current flow behaviour.
This article demonstrates how lateral variations in soil resistivity alter grounding grid impedance, surface voltage distribution, and touch voltage measurements, using a large-scale case study.
The modelling in this article was performed using ELEK SafeGrid Earthing Software.
Case Study: 360 m × 360 m Grounding Grid
The study considers a 360 m × 360 m buried grounding grid energised by a fault current applied at one corner. The site contains multiple soil regions with different resistivity values. Soil boundaries intersect parts of the grid and several electrodes.
This configuration allows observation of how the current redistributes as soil properties vary laterally.
Surface Voltage Distribution in Laterally Varying Soil
When soil resistivity changes across a site:
Current flows preferentially into lower-resistivity regions
Higher-resistivity zones restrict current
Surface voltage contours distort at soil transitions
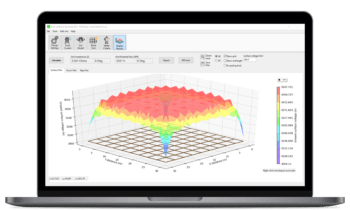
The 3D surface voltage plot below clearly shows this.

As current spreads from the injection point, the surface voltage decreases as it approaches a boundary from higher-resistivity soil and increases as it crosses into a higher-resistivity region. The change in voltage gradient reflects the redistribution of current at the boundary.
This behaviour cannot occur if soil properties are assumed identical across the site.
Touch Voltage Changes Near Soil Boundaries
Surface gradient changes directly affect touch and step voltages. In the varying-soil case, the highest gradients are influenced by soil transitions rather than by geometry alone.

The increase in gradient near boundaries is driven by resistivity contrast between adjacent soil regions. Where contrast is high, local touch voltage can increase even if the conductor geometry remains unchanged.
For large grounding grids, this can shift the location of maximum touch voltage.
Comparison with Horizontal Multilayer Soil Model
The same grid was analysed assuming soil resistivity varies only with depth. The soil model used was a horizontally stratified 3-layer soil.

This model represents a site with no lateral soil variation. However, where the actual soil conditions vary across the grid site, a single horizontal multilayer soil model (like this one) does not capture current distribution effects.
Practical Implications for Solar Farm Grounding Design
For large grounding systems:
Soil resistivity testing should cover the entire grid footprint.
Soil resistivity measurements from different locations should be modelled independently.
Grid impedance and touch voltage results should be analysed for the different soil models.
Where results differ materially, lateral soil variation should be included in the grounding model.
The decision should be based on calculated differences in grounding performance rather than resistivity values alone.
Large solar farms are particularly sensitive to deep soil variation and the position of soil boundaries relative to fault injection points.
Key Engineering Takeaways
Variations in lateral soil resistivity affect how fault current spreads through the ground. The resulting effects include:
Distortion of surface voltage contours and earth current leakage into the soil and at boundaries.
Changes in touch and step voltage gradients.
Variation in grid voltage across different soil regions (zones).
For large grounding grids, these effects can materially affect calculated grid impedance and touch-voltage results. Soil modelling should reflect actual site conditions across the full grid footprint.
Frequently Asked Questions
Does soil resistivity variation affect grounding grid impedance?
Yes. When soil resistivity varies across a site, fault current redistributes between soil regions. This changes the effective resistance seen by the grid and can alter calculated grid impedance, particularly for large grounding systems.
A single low-soil-resistivity zone can significantly reduce the grid impedance. This is because grid fault currents tend to easily flow into those low-resistivity soil zones.
How does soil variation change touch voltage results?
Touch voltage depends on surface voltage gradients. When soil resistivity varies laterally, voltage contours distort near soil boundaries, voltage increases locally, and the location of the maximum touch voltage shifts.
Why are large solar farms more sensitive to soil variation?
Large grounding grids interact with a greater volume of soil. As the grid size increases, both deep layers and lateral resistivity variation have a greater influence on current distribution and voltage behaviour.

Is a horizontal multilayer soil model sufficient for large sites?
A multilayer horizontal (depth-based) model assumes soil properties are consistent horizontally. If soil resistivity varies across the site, extending a single profile across the full footprint may not accurately reflect actual grounding behaviour. The earth grid performance for multiple soil profiles should be analysed and compared independently.
Can soil variation affect step voltage and touch voltage?
Yes. Step voltage is governed by surface voltage gradients. When soil resistivity varies laterally, gradients adjust near soil transitions, which can increase or decrease local step-voltage levels.
References
[1] ELEK SafeGrid Earthing Software Version 9.5.
[2] “IEEE Guide for Safety in AC Substation Grounding,” in IEEE Std 80-2013 (Revision of IEEE Std 80-2000/ Incorporates IEEE Std 80-2013/Cor 1-2015).