What happens to resistivity when soil freezes?
The performance of buried electrical earthing and grounding systems is highly connected with the resistivity of the soil and these resistivity values vary with the environmental conditions such as soil temperature and moisture content. In cold climates the top-soil layers in which earthing systems are buried may be frozen during winter months. This article focusses on the impacts on safety of buried electrical earthing systems installed in soils with frozen top layers.
When soils become frozen their resistivity rises significantly. For example, considering ground with uniform soil of 100 Ω.m, resistivity may increase to as high as 10,000 Ω.m when frozen. The temperature of soil at depth (1-2 meters) remains approximately constant throughout the year due to the poor heat conductivity of the soil and therefore only the surface layers are affected by the seasonal temperature changes in which the top layer of the soil (approximately 1 m depth) can be divided into multiple layers with resistivities increasing the closer we get to the surface.
Soil resistivity during winter in cold climates
Table 1 provides a standard summer uniform soil resistivity model and two typical multilayer soil resistivity models for (a) winter where the top-soil layers freeze, and multiple thin layers of high resistivity are formed where the resistivity gradually decreases to the original ambient temperature resistivity; and (b) early spring soil in which the warming temperature affects the top thin layers which are exposed to sunlight and warming weather, while the middle layers are unaffected by this change (temperature increase) and will remain frozen.
Table 1. Summer, winter, and spring soil resistivity models
| Model | Layer | Resistivity (Ω.m) | Thickness (m) |
|---|---|---|---|
| Summer | 1 | 100 | ∞ |
| Winter | 1 | 2000 | 0.2 |
| 2 | 1500 | 0.2 | |
| 3 | 1000 | 0.2 | |
| 4 | 500 | 0.2 | |
| 5 | 250 | 0.2 | |
| 6 | 100 | ∞ | |
| Spring | 1 | 100 | 0.2 |
| 2 | 500 | 0.2 | |
| 3 | 1000 | 0.2 | |
| 4 | 500 | 0.2 | |
| 5 | 250 | 0.2 | |
| 6 | 100 | ∞ |
Calculation example
The calculation example herein compares the earthing system performance for a simple grid installed in different soil models per Table 1 for summer, winter, and spring conditions.
The grid is 20 m × 20 m with 16 meshes and the grid is injected with a 1000 A fault current as shown in Figure 1. The grid is buried at 0.45m depth (Figure 2).
Table 2. Modelling results for simple grid in summer, winter, and spring (soil) conditions
| Model | Grid | Results | ||||
|---|---|---|---|---|---|---|
| Resistance (Ω) | GPR (V) | Surface voltage max (V) | Touch voltage max (V) | Step voltage max (V) | ||
| Summer | Standard | 2.38 | 2380 | 2278.9 V | 1073 V | 356.3 V |
| With rods | 2.23 | 2230 | 2200 | 853.3 | 324.6 | |
| Winter | Standard | 6.395 | 6394.9 | 4682.7 V | 5076.5 | 1819.9 |
| With rods | 3.82 | 3818.3 | 3366.4 | 2251.8 | 1002.2 | |
| Spring | Standard | 5.59 | 5591.7 | 3434 | 4185.9 | 700.5 |
| With rods | 3.6 | 3596.8 | 2690 | 2085 | 421.7 | |
The grid resistance and GPR increased by as much as 135 % during winter when compared with summer values and touch voltages increased by as much as 105 %. When rods were added to the grid then grid resistance, GPR and touch voltages did not increase by as much.
In fact, with rods installed during winter the maximum touch voltage was close to the value during summer, 2251.8 V and 2278.9 V, respectively.
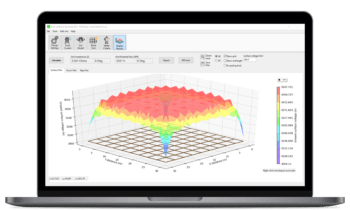
The plots for surface, touch, and step voltages from the modelling software (including with rods) are shown in the Appendix.
Figure 1. 20m×20m 16-mesh grid model

Figure 2. Multilayer winter soil model with the grid buried at 0.45 m

Conclusions and Recommendations
For an earthing design to be accurate it is important to consider the soil resistivity conditions for all seasons – this is covered in IEEE Std. 81 [2]. For locations where the soil surface layers can freeze during winter, the soil resistivity will significantly increase affecting the earthing and giving rise to higher touch voltages during fault conditions during winter or early spring. Therefore, an earthing designer must consider the worst-case soil resistivity during these times and a conservative soil model must be utilized.
We make the following recommendations:
- Take soil resistivity measurements during both summer and winter conditions.
- Include the frozen top-soil layers in your soil resistivity model.
- Where the soils can be frozen during winter, utilize vertical rods for your designs to significantly reduce touch voltages.
References
[1] IEEE Std 80-2013, IEEE Guide for Safety in AC Substation Grounding.
[2] IEEE Std 81-2012, IEEE Guide for Measuring Earth Resistivity, Ground Impedance, and Earth Surface Potentials of a Grounding System.
[3] SafeGrid Earthing Software, V5.1.
Appendix – Modelling results
Surface Voltages
Figure 3. 3D surface voltages for summer soil model

Figure 4. Line profile plot of surface voltages for all soil models

Figure 5. Line profile plot of surface voltages for all soil models – including rods

Touch Voltages
Figure 6. 3D touch voltages for summer soil model

Figure 7. Line profile plot of touch voltages for all soil models

Figure 8. Line profile plot of touch voltages for all soil models – including rods

Step Voltage
Figure 9. 3D touch voltages for summer soil model

Figure 10. Line profile plot of step voltages for all soil models

Figure 11. Line profile plot of step voltages for all soil models – including rods