Table of Contents
Abstract
This paper comprehensively analyses current rating methodologies for high voltage direct current (HVDC) cables, focusing on thermal and electrical (stress) constraints under various installation conditions. Unique HVDC phenomena, including field inversion and temperature-dependent insulation conductivity, are examined in detail.
The studies apply internationally recognised standards and incorporate findings from finite element modelling and case studies to evaluate how factors such as conductor size, operating voltage, insulation thickness, and installation conditions, including pole separation, influence HVDC cable thermal and stress-limited current ratings.
This paper extends the research on the current ratings of HVDC cables. The results highlight the dominant role of stress-limited ratings in many scenarios and the critical importance of insulation design and installation practices. The influence of stress limits on the operating voltage corresponding to peak transmission capacity is also examined. Practical recommendations are provided to maximise current-carrying capacity and ensure HVDC cable systems’ safe, reliable operation.
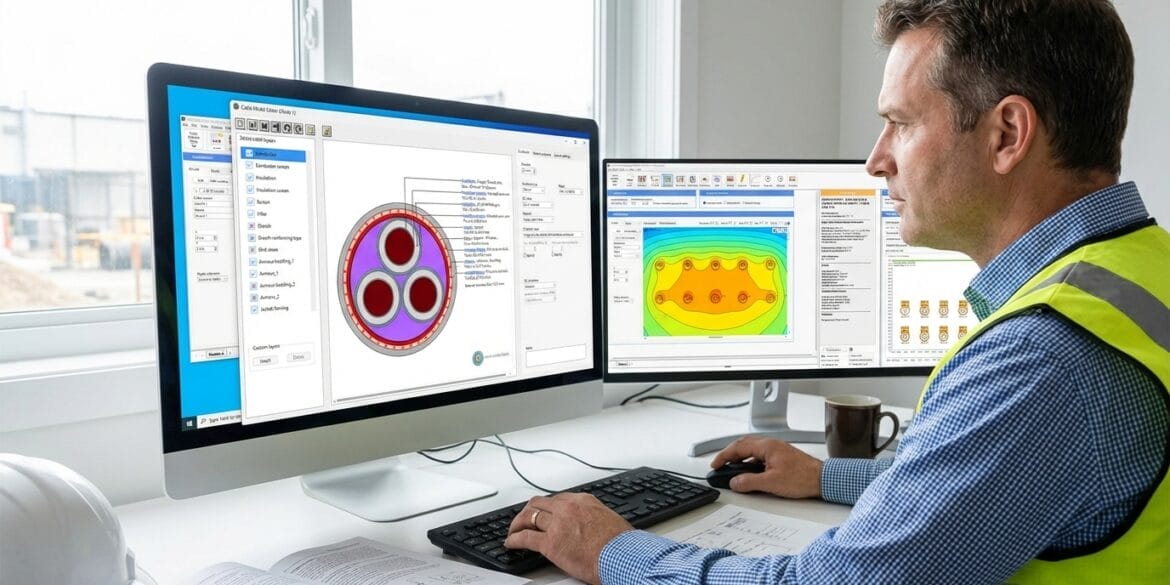
The HVDC cable current rating calculations have been performed using ELEK Cable HV Software.
Introduction
HVDC cables are essential for efficient long-distance power transmission and grid interconnection. Unlike AC systems, HVDC cables do not experience frequency-dependent electrical losses, resulting in lower resistive losses, uniform current distribution, and higher current rating (ampacity). However, determining the current rating of HVDC cables is more complex than determining the rating of AC cables. While AC and DC cables are limited by maximum conductor temperature and insulation electrical stress, the development of electric field stress in the insulation differs fundamentally. In AC cables, field distribution is determined by cable geometry and applied voltage. In contrast, in HVDC cables, the steady-state electric field distribution is governed by the temperature-dependent electrical conductivity of the insulation, making it resistive rather than capacitive [1].
This paper applies the standard methodology for calculating HVDC cable current ratings, as established by the IEC 60287 series of standards, which provides the equations and procedures for determining cable current-carrying capacity under steady-state conditions. The analysis relies on these internationally recognised standards and incorporates key findings from prior research, including CIGRÉ Technical Brochures and published studies on HVDC cable thermal and electrical stress constraints. The paper’s scope covers thermal and stress-limited current ratings for HVDC cables under various installation conditions, referencing established calculation methods and validated by comparisons with finite element modelling and reported case studies.
As HVDC cable current increases, the resulting temperature gradient across the insulation creates conductivity gradients and space charge accumulation, leading to field inversion—a phenomenon where peak electrical stress shifts from the conductor interface to the outer insulation—due to insulation resistivity decreasing exponentially with temperature [2]-[3]. To ensure that the electric field within the insulation remains within acceptable limits, the temperature difference across the insulation is restricted, which can impose a stricter limit on current rating than the maximum conductor temperature, making HVDC cable ratings frequently stress-limited rather than solely thermal-limited.
The impact of installation conditions for buried cables—such as burial depth, soil thermal resistivity, and cable spacing—on the electrical stress within the insulation and, hence, current ratings, is significant. These factors alter the thermal environment and the resulting temperature profile across the insulation, thereby affecting the electric field distribution and the maximum allowable current. Similarly, for air-installed cables, conductor size, material, voltage, and ambient temperature strongly impact thermal behaviour, heat dissipation, insulation stress, and current capacity. In ventilated tunnels, tunnel length, depth, and air velocity affect convective cooling, altering insulation temperature and electric field distribution, thus influencing current ratings. This paper presents a parametric analysis of these installation scenarios, explicitly focusing on bipole HVDC systems. In addition, a study is also conducted on how the electrical stress limit influences the operating voltage at which the maximum transmission capacity is achieved.
HVDC current rating calculations
The current rating of HVDC cables is determined by the lower of the two principal constraints:
Thermal limit (maximum allowable conductor temperature).
Stress (dielectric) limit (maximum permissible electric field strength within the insulation).
While both constraints are fundamental to cable rating calculations, this paper will focus on providing a detailed explanation of stress-limited ratings. The discussion of thermal-limited ratings will be limited and not covered in detail.
Thermal-limited current ratings
The thermal-limited current rating (Ithermal) is calculated using standard IEC 60287 Series [4], which considers the permissible temperature rise of the conductor and the total thermal resistance from the conductor to the environment. The equation for a single-core cable is:
(1) \(I_{\text{thermal}} = \sqrt{ \frac{\Delta \theta}{R_{dc} (T_1 + T_2 + T_3 + T_4) }}
\)
Where:
Δθ: Permissible temperature rise above ambient
Rdc: DC resistance of the conductor (Ω/m) at maximum temperature
T1 is the thermal resistance per unit length between one conductor and the sheath (K·m/W)
T2 is the thermal resistance per unit length of the bedding between sheath and armour (K·m/W)
T3 is the thermal resistance per unit length of the external protective cover of the cable (K·m/W)
T4 is the thermal resistance per unit length between the cable surface and the surrounding medium (K·m/W)
Cable construction, installation method (air, buried, ducts, tunnels), and environmental conditions influence thermal resistance values. Equation (1) can be applied for voltages up to 5 kV; however, since typical HVDC voltages are much higher, stress-limited current ratings must also be considered to determine the cable’s effective current capacity accurately.
Stress-limited current ratings
The maximum electric field dictates the stress-limited current rating that the insulation can withstand, which is affected by the temperature drop across the insulation caused by the cable current. During loading of an HVDC cable, the electric field distribution transitions from an initial capacitive profile (which is ignored) to a steady-state resistive profile.
(2) \(E_{res}\left(r\right)=\frac{U\delta(r/R_0)^{\delta-1}}{R_0 – R_0(R_i/R_0)^{\delta}}
\)
(3) \(\delta = \frac{\alpha W_c/(2\pi\lambda) + \gamma U/(R_0 – R_i)}{\gamma U/(R_0 – R_i) + 1}\)
(4) \(\theta_{\text{drop}} = \frac{W_c\rho_{i}}{2\pi} \ln\left(\frac{R_o}{R_i}\right)
\)
Where:
U is the applied voltage (kV). Note this can be the system/rated voltage, Un, or the maximum voltage Um, as defined in IEC 60183.
Ri and Ro represent the inner and outer radius of the insulation.
α is the field temperature dependency coefficient (0.11 K⁻¹ for XLPE insulation [6]).
λ is the thermal conductivity of the insulation material, in W/(m.K).
γ is the electric field coefficient (0.24 mm/kV/mm for XLPE insulation [6]).
Wc is the Joule (ohmic) conductor loss in W/m.
ρi is the insulation’s thermal resistivity in K.m/W
Figure 1 illustrates how the electric field varies across the insulation radius for different insulation temperature drops (θdrop), corresponding to varying cable current loads. At zero temperature drop (θdrop=0 K), representing no load, the maximum electric field is located at the inner edge of the insulation, near the conductor. As the temperature drop increases (indicating higher current loading), the point of maximum electric field shifts outward toward the outer insulation surface. This phenomenon, known as field inversion, becomes more pronounced at higher θdrop values, such as 10.7 K, resulting in significantly elevated electrical stress at the outer insulation boundary. The risk of insulation breakdown at the outer surface increases with increasing thermal gradients due to this shift in electric field distribution.

Stress-limited current ratings can be determined using the permissible electrical stress on the insulation (Emax in kV/mm). Still, the allowable insulation temperature drop (θdrop in K) is commonly used. The insulation temperature drop limit is determined during type testing and must not be exceeded in operation.
According to CIGRÉ TB 852 [7], HVDC cable systems are classified as ≤400 kV with average stress ≤20 kV/mm, while EHVDC systems have voltage > 400 kV and stress limits higher than 20 kV/mm. However, electrical stress limits are more specifically defined for different insulation types; for example, the limit for mass-impregnated insulation is typically 30 kV/mm [8], [9].
Figure 2 shows how maximum electric stress (the maximum of inner or outer insulation) varies with insulation temperature drop for cables with different conductor sizes and voltage ratings. The 320 kV and 525 kV cables have insulation thicknesses of 20 mm and 30 mm, respectively, except for the 320 kV 2000 mm2 [10] cable, which has an insulation thickness of 16 mm.
The following points are observed from the plot:
As the insulation temperature drop increases, the maximum electric stress decreases in the thermal region of the curve, before field inversion occurs. In contrast, in the field inversion region, the maximum electric stress rises with increasing temperature drop.
For a given insulation temperature drop, cables with larger conductor sizes or operating at higher voltages experience a greater maximum electric field.
Increasing the conductor size increases the maximum electric field, thus reducing the corresponding maximum permissible insulation temperature drop. Equation 4 explains the cause, showing that the change in the inner and outer radii of the insulation (Ri and Ro) is responsible.
Increasing the insulation thickness (for the same operating voltage) reduces the maximum electric field, thus increasing allowable temperature drop. For example, increasing the insulation thickness from 16 mm to 20 mm in the 320 kV cable increases the allowable insulation temperature drop limit by about threefold.
 for different voltage cables and varying conductor sizes.")
Transmission capacity
This section evaluates how maximum allowable electrical stress impacts the transmission capacity of HVDC cables across various operating voltages, where variations to insulation stress limits and conductor sizes are also considered. For a given Emax and operating voltage, the insulation temperature drop limit is calculated, and current ratings are then determined using software based on a maximum continuous conductor operating temperature of 90 °C.
Figure 3 shows transmission capacity in megawatts (MW) versus operating voltage for a 525 kV, 3000 mm² HVDC cable for different maximum electrical stress limits (18 kV/mm, 19 kV/mm, and 20 kV/mm) under fixed installation conditions (buried at 1 m depth with a separation of 1 m between cables). The solid lines correspond to transmission capacity, whereas the dashed lines show the insulation temperature drop limit. The arrows indicate the voltages at peak transmission capacity for each Emax.
The following points are observed from the plot:
Transmission capacity increases with operating voltage until the cable’s current-carrying capacity becomes limited by electric stress. This is because a cable’s maximum allowable temperature drop limit is reduced by its operating voltage.
Peak transmission capacity occurs at an operating voltage below the cable’s rated 525 kV. A separate analysis performed by the authors also showed that the operating voltage at which peak transmission capacity occurs does not depend on conductor size.
The electrical stress limit of the cable’s insulation significantly affects the transmission capacity.

Parametric analysis of thermal-electric ratings
This section presents a parametric analysis to explore how installation factors affect stress-limited and thermal-limited current ratings.
For cables in the air, the effect of the following parameters on the current rating is studied: conductor size, conductor material, cable voltage, and ambient air temperature.
For buried cables, the effect of the following parameters on the current rating is studied: soil dry-out, burial depth, cable separation, and buried-in ducts. Finite element method (FEM) calculations have also been performed simulating isothermal and non-isothermal ground surface conditions.
For ventilated tunnels, the effect of the following parameters on the stress-limited and thermal-limited current rating is studied: tunnel length, depth, and air velocity.
In Air
An analysis of thermal and stress-limited current ratings for copper and aluminium HVDC cables at 320 kV, ambient temperature 40 °C, and conductor sizes from 630 mm² to 3000 mm² shows that copper conductors consistently achieve higher current ratings than aluminium. Both materials remain thermal-limited across all conductor sizes for a 19 kV/mm stress limit. However, at 18 kV/mm, the cables become stress-limited, highlighting the importance of obtaining accurate maximum allowable electrical stress values from the manufacturer.
Figure 4 shows thermal and stress-limited current ratings and insulation temperature drop limits for copper cables operating at 320 kV and 525 kV, with a maximum electrical stress of 19 kV/mm. The following points are observed from the plot:
Due to the lower insulation temperature drop limit and higher thermal resistance between conductor and sheath, the 525 kV cable has a lower current rating. However, its transmission capacity is higher than that of a 320 kV cable.
With a maximum electrical stress limit of 19 kV/mm, the 525 kV cables are stress-limited, while the 320 kV cables remain thermally limited across all conductor sizes.

Figure 5 shows how current ratings of a copper 320 kV HVDC cable change with ambient temperature for 630 mm², 1600 mm², and 3000 mm² conductors, illustrating the transition points between thermal and stress limits. The following points are observed from the plot:
Thermal-limited ratings decrease significantly with increasing ambient temperature, while stress-limited ratings remain relatively stable.
Smaller conductor sizes will likely be thermally limited across a wider temperature range.
Electric stress is the dominant constraint at low ambient temperatures for large conductor sizes.
It is important to note that the maximum allowable electric stress limit (and corresponding allowable insulation temperature drop) significantly impacts current ratings. For example, increasing it from 19 to 20 kV/mm raises the current rating by 12%.

Buried cables
A circuit comprising two directly buried HVDC cables is analysed across various burial depths and cable separations, considering both soil dry-out and non-dry-out scenarios. Furthermore, FEM is employed to determine current ratings under both isothermal and non-isothermal ground surface conditions. Isothermal surfaces are surfaces along which the temperature is assumed to be constant. IEC methods assume an isothermal soil surface so that Kennelley’s hypothesis can be applied. Non-isothermal surfaces assume a different temperature at the soil-air interface.
The study utilises a 320 kV, 2000 mm² cable from CIGRÉ TB 880 Case Study 7 [10], specified with a maximum operating temperature of 70 °C and an insulation temperature drop limit of 10.7 K. This temperature drop corresponds to a maximum electric stress of 21.28 kV/mm, which serves as the basis for calculating stress-limited current ratings.
Burial depth
Figure 6 shows the thermal and stress-limited current ratings versus burial depth for a 1 m separation. Solid lines show effective and FEM-based current ratings, while dotted lines indicate thermal and stress-limited current ratings. Effective (thermal-electric ratings) are obtained as the minimum of the thermal and stress-limited ratings.
The following points are observed from the plot:
Stress-limited ratings at shallow burial depths limit effective current ratings, as electrical stress within the insulation becomes the dominant constraint.
At deeper burial depths, thermal-limited ratings become the primary constraint on effective current ratings, due to the reduced effectiveness of dissipating heat through the surrounding soil.
FEM current ratings closely match thermal-electric ratings calculated using IEC 60287 under isothermal ground surface conditions. Still, they are notably lower when non-isothermal boundary conditions are applied.

Bipole separation
Figure 7 shows thermal and stress-limited current ratings versus pole separation for 1 m and 10 m burial depths. The following points are observed from the plot:
Stress-limited ratings remain largely unchanged with varying cable separation.
As cable separation increases from 1 m to 10 m, thermal ratings improve due to reduced mutual heating, though the gains gradually reduce with further separation.
Effective current ratings are governed by stress limits at 1 m depth and thermal limits at 10 m depth, regardless of cable separation.

Soil drying out
Soil drying out refers to the process where heat generated by buried power cables causes a temperature gradient in the surrounding soil, which in turn causes moisture to migrate away from the cable surface. This creates a dry soil zone around the cables, increasing thermal resistivity. Direct buried cables are more susceptible to experiencing soil dry out than cables in ducts because the cable’s surface is in direct contact with the soil.
Figure 8 presents thermal and stress-limited current ratings with and without soil dry-out. The following points are observed from the plot:
Soil dryout significantly reduces effective current ratings.
The impact of burial depth is more severe under dryout conditions, with effective ratings dropping more steeply (20.5 % decline) as depth increases compared to non-dryout conditions (10.34 % decline) as burial depth increases from 1 m to 8 m.
Under soil-dryout conditions, effective current ratings become limited by thermal constraints at much shallower burial depths (1.6 m) compared to non-dryout conditions (3 m).
Stress-limited current ratings are consistently lower under soil dry-out conditions due to higher conductor temperatures, which increase the DC conductor resistance and reduce the cable’s current-carrying capacity.
Without soil dry out, stress-limited ratings remain relatively stable (3.6% change) across burial depths between 1 m and 8 m, while with soil dry out, they decrease significantly (10.2%) with increasing burial depth.
When carrying the same current, the conductor temperature rises sharply with burial depth when soil dries out, reaching 125 °C at 8 m, compared to just 81 °C when there is no dry out.
 versus burial depths under dryout and non-dryout soil conditions for a separation of 1 m.")
Figures 9 and 10 show the soil temperature distribution with and without soil drying out for a directly buried circuit with 1 m pole separation and at 5 m depth. At a current of 1902.6 A, soil dry-out raises the conductor temperature from 70 °C to 114.1 °C, a 63% increase compared to non-dry-out conditions.


Ducts
High-voltage cables are placed in ducts rather than directly buried to streamline installation and maintenance tasks. This makes it easier to access or swap out cables when necessary. Generally, the addition of ducts hinders heat dissipation from the cables and lowers their current-carrying capacity compared to cables directly buried in soil.
Figure 11 illustrates the variation in thermal-electric current ratings (solid lines) and insulation temperature drop (dotted lines) with burial depth for HVDC cables spaced 5 m apart, comparing direct-buried installation with duct installation. Below are the observations from the figure.
Direct-buried cables have higher current ratings than in-duct cables across all burial depths.
When ratings are stress-limited (10.7 °C allowable insulation drop), the difference in current ratings between direct-buried and in-duct installations is smaller than when ratings are thermal-limited.
Thermal-limited ratings become the limiting factor for in-duct cables at much shallower depths compared to direct-buried cables.

Ventilated tunnels
HVDC cables are installed in tunnels to reduce surface disruption and protect existing infrastructure in urban areas. Due to lower power losses, they are especially suited for long-distance underground transmission. Tunnels also offer easier access for maintenance, improve heat dissipation through ventilation, and protect cables from environmental and construction-related risks.
The cable model for ventilated tunnels is a 525 kV 1000 mm2 HVDC single-core cable with an outer diameter of 130.5 mm. The maximum conductor temperature is 90 °C, and the allowable maximum electrical stress is 20 k V/mm. The analysis uses a rectangular tunnel with outer cross-sectional dimensions of 2.9×1.9 m2 and inner dimensions of 2.5×1.5 m2. Tunnel length, depth, and air velocity are varied to assess their impact on current ratings. Native soil thermal resistivity is 1.2 K·m/W, tunnel wall resistivity is 1 K·m/W, and ground surface temperature is 25 °C.
The cable circuit consists of two HVDC cables spaced vertically along the inner edges of the tunnel wall, as shown in Figure 12. This image was taken from cable sizing software.

Varying tunnel length
Figure 13 presents the variation of thermal-limited and stress-limited current ratings (dotted lines), effective current rating, and insulation temperature drop with increasing tunnel length for an air velocity (inside the tunnel) of 2 m/s. Below are the observations from the figure.
Tunnel length has a greater impact on thermal-limited current ratings (18.9%) than stress-limited ratings (3.8%) as tunnel length increases from 500 m to 10 km.
Effective current ratings are stress-limited for smaller tunnels and become thermal-limited as the tunnel length increases.
Insulation temperature drop in stress-limited current rating regions is constant. In contrast, it decreases with increasing tunnel length when the ratings are thermal-limited.
, effective current rating, and insulation temperature drop with increasing tunnel length.")
Variation in air velocity
Figure 14 shows the variation of thermal-limited and stress-limited current ratings with tunnel length for different air velocities. The solid lines represent thermal-limited current ratings, while the dashed lines represent stress-limited current ratings for air velocities of 0.5 m/s to 5 m/s. The highlighted circles show the transition from stress-limited to thermal-limited current ratings. Below are the observations from the figure.
Stress-limited current ratings are largely unaffected by tunnel length.
Stress-limited ratings become the main constraint for short tunnels and higher air velocities.
For large tunnels, thermal-limited ratings determine effective current ratings due to the sharp rise in temperature with tunnel length.
As air velocity increases from 1 m/s to 5 m/s, stress-limited ratings govern over longer tunnel lengths, shown by highlighted circles marking the stress-to-thermal limit transition.
At lower air velocities, thermal current ratings decline sharply with increasing tunnel lengths, reaching their minimum values over much smaller tunnel lengths and leveling off earlier.

Varying tunnel depth
Figure 15 illustrates thermal and stress-limited current ratings vs. tunnel depth for different tunnel lengths and an air velocity of 2 m/s. The observations from the figure are below.
Tunnel depth has minimal impact on stress-limited current ratings, changing between 0.1% (1 km tunnel) and 1.8% (10 km tunnel) for an increase in tunnel depth from 2 m to 5 m.
For short tunnels (1 km), depth has an insignificant impact on stress-limited (0.1%) or thermal-limited current ratings (0.6%) for an increase in tunnel depth from 2 m to 5 m.
For thermal-limited ratings, tunnel depth has a greater impact in longer tunnels (e.g., 10 km), with ratings dropping by 7.3% with increasing tunnel depth from 2 m to 5 m.
Stress-limited ratings constrain the effective ratings for shorter tunnels (1 km and 2 km), while thermal-limited current ratings dominate for longer tunnels (5 km and 10 km).
. Each colour represents a specific tunnel length.")
Conclusions and recommendations
This study presents a comprehensive analysis of HVDC cables under various installation conditions, focusing on thermal-electric constraints. It was shown that the maximum permissible electric stress of HVDC cables significantly affects current ratings; a 1 kV/mm rise can potentially boost ratings by up to 12%. Insulation thickness strongly impacts insulation temperature drop limit; a 20% increase in thickness can triple that limit. Higher cable operating voltages are likely to make current ratings stress-limited, resulting in peak transmission capacity occurring at a lower voltage than the cable’s rated voltage.
Parametric analysis revealed that the insulation temperature drop limit decreases with conductor size. Cables are stress-limited at low ambient temperatures. For buried cables, stress-limited ratings dominate at shallow depths and larger bipolar separation, while thermal constraints become critical at greater depths and soil dry-out. For cables in a tunnel, the effective rating shifts from stress-limited in short tunnels to thermal-limited in long tunnels. At higher tunnel air velocities, cables become stress-limited.
Insulation thickness should be optimised to increase the insulation temperature drop limit and enhance transmission capacity. Installation depth, soil conditions, and tunnel ventilation must be considered, as they influence whether thermal or electrical stress becomes the governing constraint. Design strategies should also address stress-limited constraints in favourable ambient temperatures and high-voltage cables.
References
[1] M. J. P. Jeroense and P. H. F. Morshuis, 1998, “Electric fields in HVDC paper-insulated cables,” in IEEE Transactions on Dielectrics and Electrical Insulation, vol. 5, no. 2, pp. 225-236.
[2] I. W. McAllister, G. C. Crichton and A. Pedersen, 1994, “Charge accumulation in DC cables: a macroscopic approach,” Proceedings of 1994 IEEE International Symposium on Electrical Insulation, Pittsburgh, PA, USA, pp. 212-216.
[3] Giovanni Mazzanti; Massimo Marzinotto, 2013, “Main Principles of HVDC Extruded Cable Design,” in Extruded Cables for High-Voltage Direct-Current Transmission: Advances in Research and Development, pp.41-98.
[4] International Electrotechnical Commission (IEC). IEC 60287-1-1:2006 – Electric cables – Calculation of the current rating – Part 1-1: Current rating equations (100 % load factor) and calculation of losses – General. Geneva, Switzerland: IEC, 2006.
[5] Eoll, C.K., 1975. “Theory of stress distribution in insulation of high-voltage DC cables: Part I” IEEE Transactions on electrical insulation, (1), pp.27-35.
[6] D. Chu and B. M. Weedy, 1984, “HVDC Extruded Cables-Parameters For Determination of Stress,” in IEEE Transactions on Power Apparatus and Systems, vol. PAS-103, no. 3, pp. 662-667.
[7] CIGRÉ, “Recommendations for testing DC extruded cable systems for power transmission at a rated voltage up to and including 800 kV, CIGRÉ Technical Brochure 852,” Paris, France, Nov. 2021.
[8] Huang, Z., Pilgrim, J.A., Lewin, P.L., Swinger, S. and Tzemis, G., 2015, “HVDC cable rating methodology: thermal electrical and mechanical constraints.“ In Proc. 9th Int. Conf. Insul. Power Cables (Jicable 2015) (pp. E2-3).
[9] Z. Y. Huang, J. A. Pilgrim, P. L. Lewin, S. G. Swingler and G. Tzemis, 2015 “Thermal-Electric Rating Method for Mass-Impregnated Paper-Insulated HVDC Cable Circuits,” in IEEE Transactions on Power Delivery, vol. 30, no. 1, pp. 437-444.
[10] CIGRÉ Technical Brochure 880. Power Cable Rating Examples for Calculation Tool Verification. CIGRÉ, Paris, 2022.