Table of Contents
Introduction
The current rating of cables is affected by the installation conditions, the cable system design and the materials and construction of the cables themselves. In this report, a parametric study of the factors which affect current ratings is presented.
For cables in air, the effect on the current rating of the following parameters is studied: conductor size, conductor material, sheath bonding arrangement, ambient air temperature, enclosing in the duct, duct size, duct material, exposure to direct solar radiation and separation between groups of cables in air.
For buried cables, the effect on the current rating of the following parameters is studied: soil dry-out, soil thermal resistivity, phase separation, standing voltage, single-core sheath loss factor, multi-core sheath loss factor, multiple buried circuits, soil ambient temperature, backfill thermal resistivity and backfill construction.
For various sheath bonding configurations, the effect on the current rating of the following parameters is studied: phase spacing for solid bonding, sheath circulating current and standing voltage, varying phase spacing along the route, and varying minor section length for solidly bonded and cross-bonded cables.
Refer to our Sheath Bonding Design for High Voltage Cables technical article.
Modelling was performed using ELEK Cable HV Software™, which uses calculations according to the IEC 60287 standards [ref. 1], equations published by Neher and McGrath, and the finite element method. The calculation results of the software have been validated with CIGRE Technical Brochure 880 [ref. 2].
Common parameters
The following common parameters were used for the modelling of the cables:
- Load factor = 1.0
- Sheath bonding = Solid
- Conductor material = Copper
- Ambient air temperature = 40 °C
- Ambient soil temperature = 25 °C
- Maximum conductor temperature = 90 °C
- Depth of burial = 0.7 metres
- Native soil thermal resistivity = 1.2 °C.m/W
- Dry soil thermal resistivity = 2.5 °C.m/W
- Dry soil critical temperature = 40 °C
- Cable sheath solar absorption coefficient, σ = 0.8
- PVC duct thermal resistance = 6 °C.m/W
- Metal duct thermal resistance = 0 °C.m/W
- Backfill thermal resistivity = 1 °C.m/W
The models for the 11 kV cables used in the parametric study are included in the Appendix.
In Air
Varying conductor sizes and conductor material
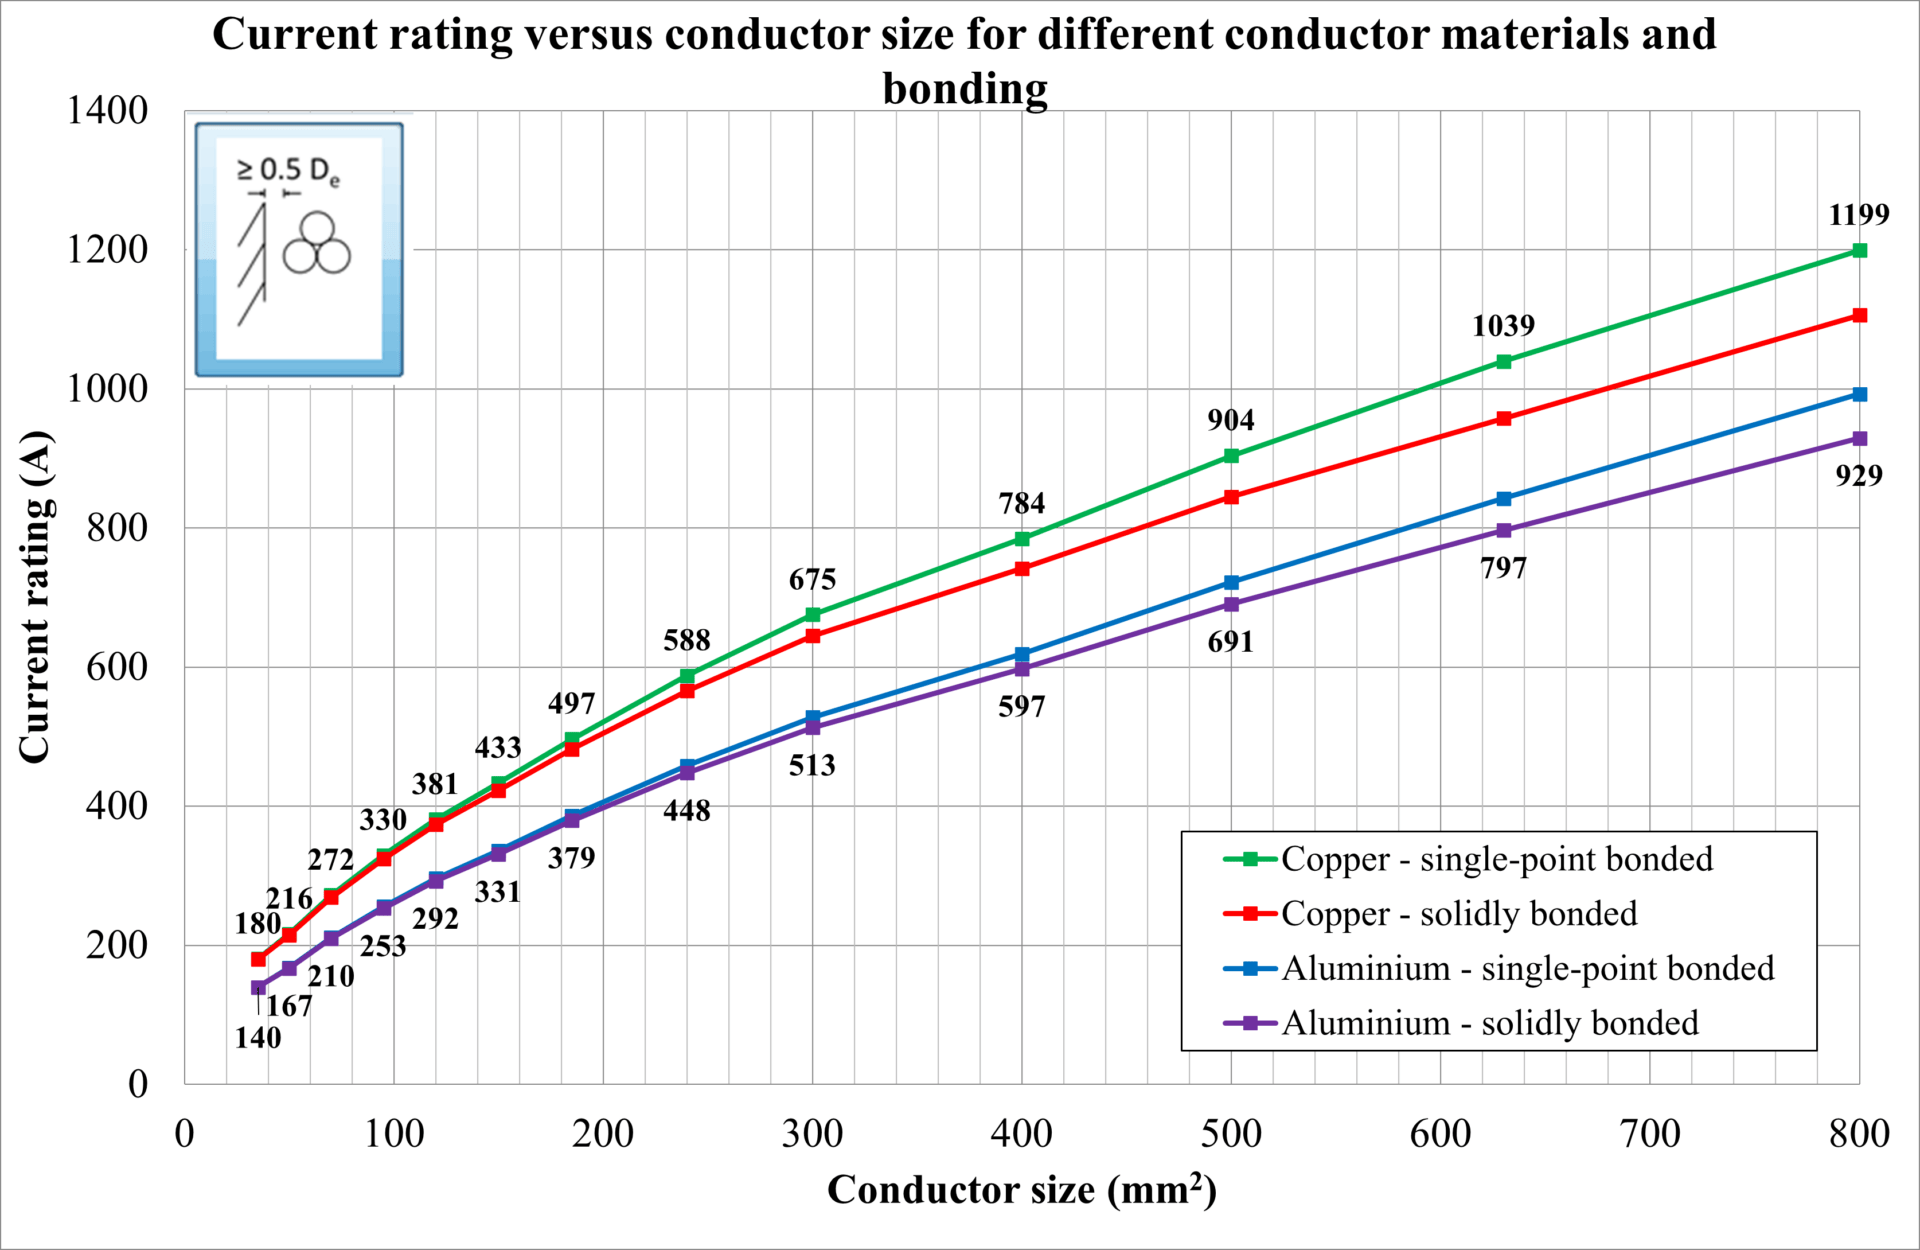
The conductor size has been varied from 35 mm2 up to 800 mm2. Cables are modelled as installed spaced from a wall in a trefoil arrangement. Below is a list of the observations from Figure 1.
The current rating of cables increases with conductor size.
Cables with copper conductors have a higher rating than those with Aluminum conductors.
The DC resistance of a conductor is inversely proportional to its size. However, doubling the conductor size does not double the current rating. This is because for AC currents, the contribution of the skin and proximity effects to conductor resistance, especially for large conductors, is significant.
Circulating and eddy currents will flow in the metal sheath for single-core cables with solid bonding. Circulating current losses are generally much larger than eddy current losses; hence, the current rating for solidly bonded cables is lower than for single-point bonded cables.
The larger the conductor size, the larger the circulating current losses (significant for solidly bonded cables but not applicable for single-point bonded cables) and eddy current losses.
Ambient air temperature
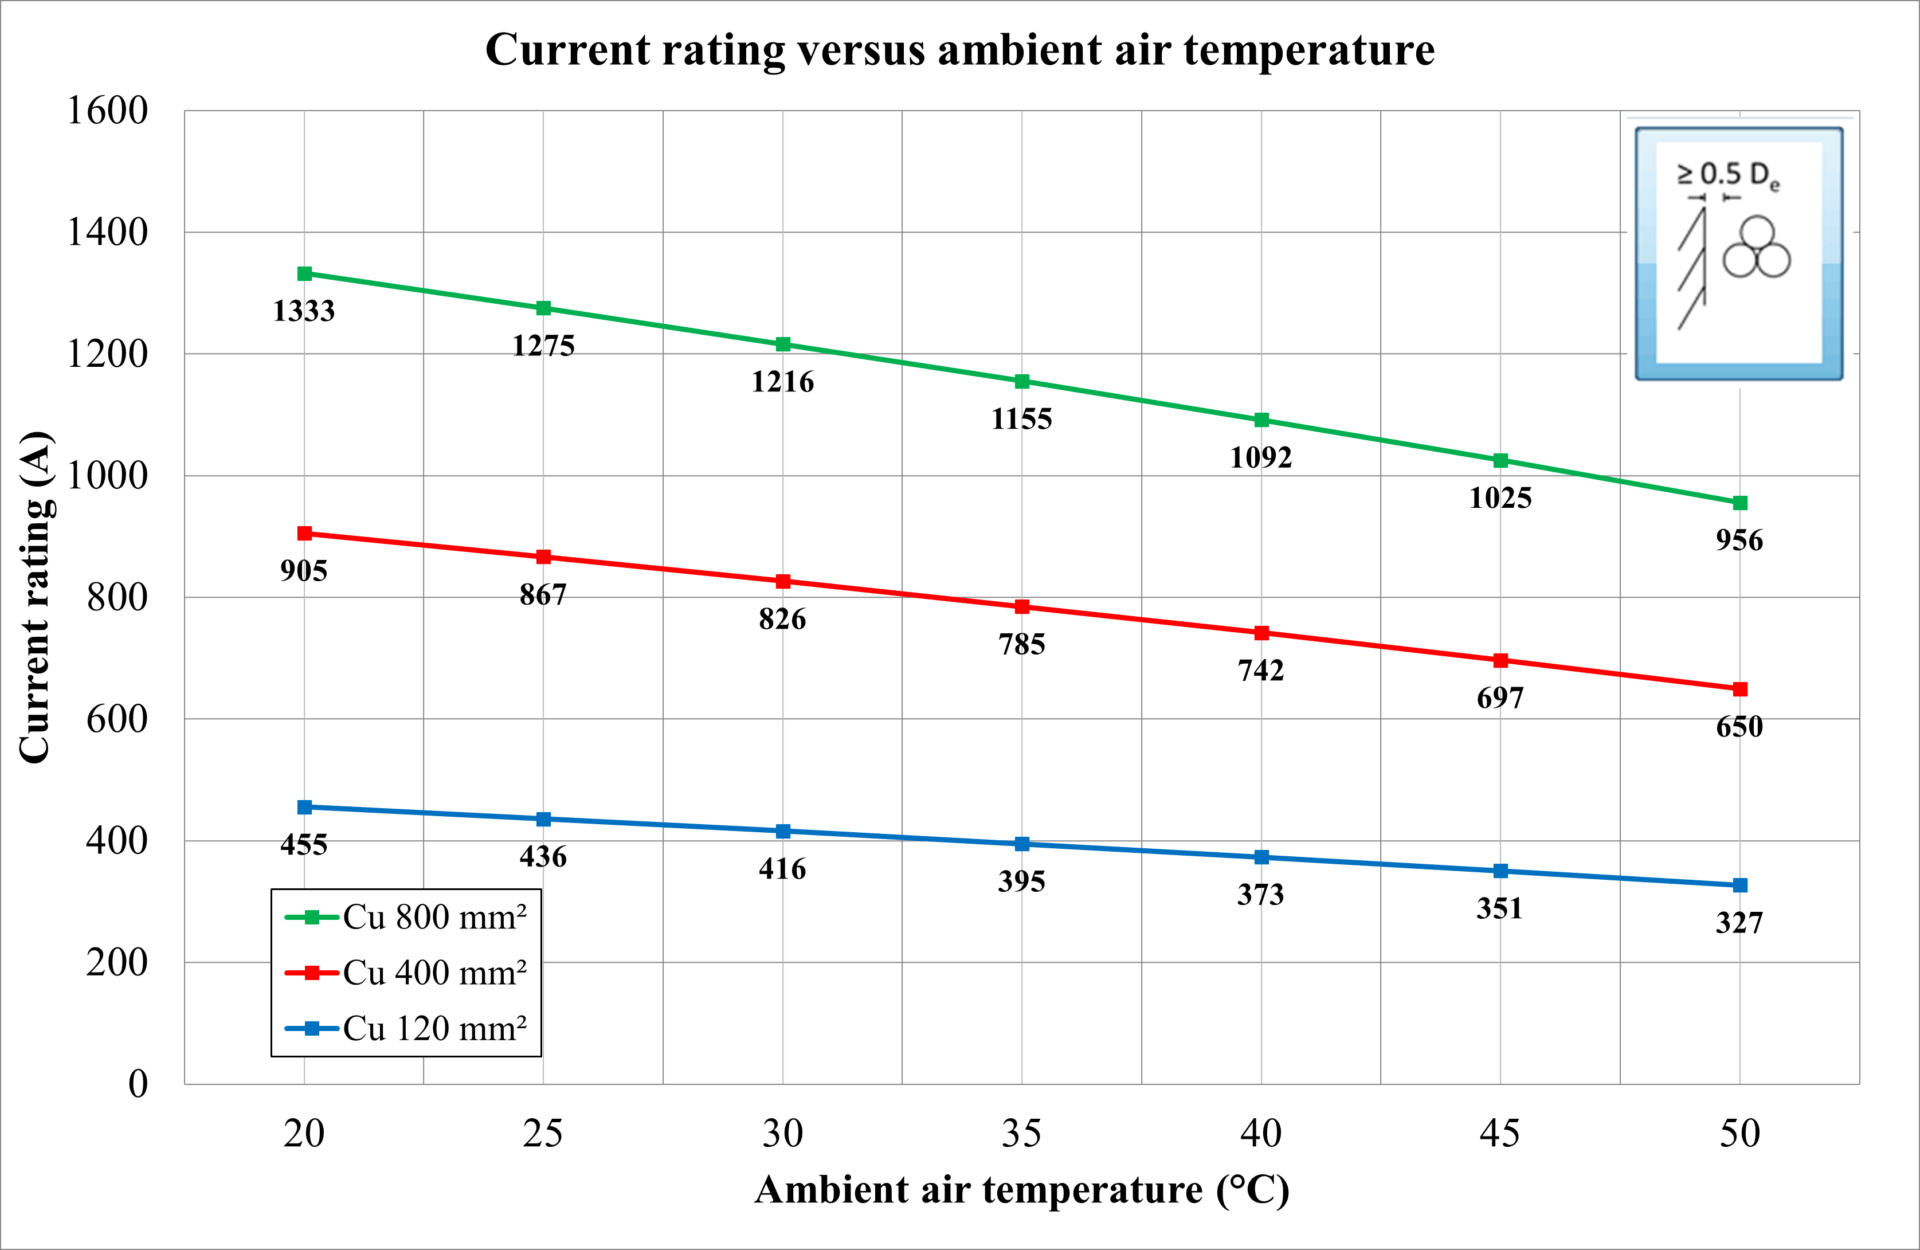
The ambient air temperature was varied between 20 ̊C and 50 ̊C for different cable sizes, and the current rating was calculated. Below is a list of the observations from Figure 2.
For all cables, as ambient (environment) temperature, whether air or soil, is increased nearer to the maximum conductor temperature limit, the current rating is reduced.
For cables in air specifically, the relationship between current rating and air temperature is a non-linear function of the excess of cable surface temperature above ambient air temperature and also depends on the outer surface area (size) of the cable – since, as can be seen, the rate of change in current rating with ambient air temperature is different for the cable sizes (diameters).
Enclosed in ducts in air
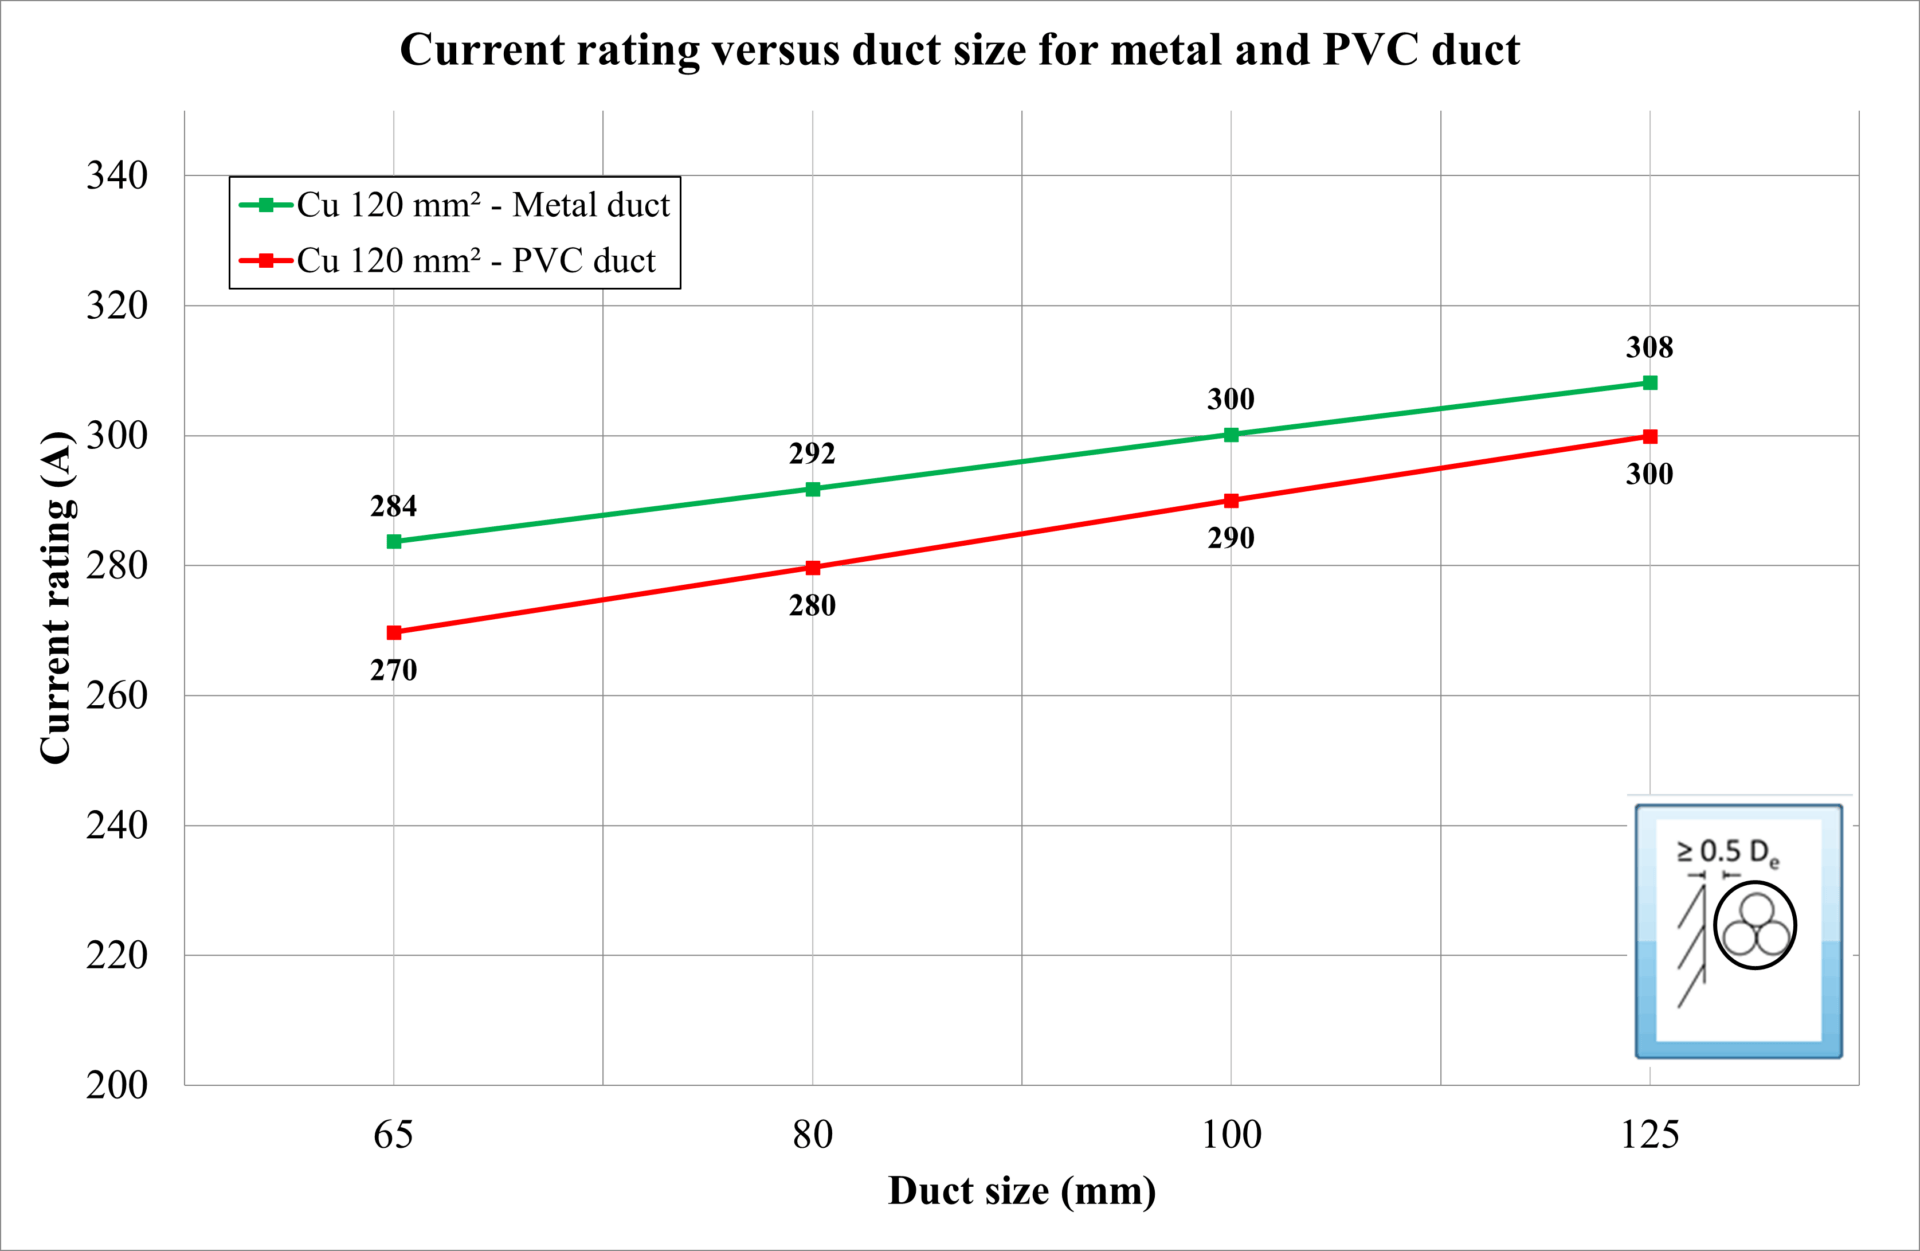
The duct size was varied for three cables enclosed (combined) in a duct, and the current rating was calculated. The duct material was also changed between PVC, which has a thermal resistivity of 6 K.m/W, and metal, which has negligible thermal resistivity. Below is a list of the observations from Figure 3.
The current rating of cables enclosed in ducts is reduced compared with unenclosed ones. This reduction is caused by the added thermal resistance of the duct wall and the raised temperature of the air enclosed inside the duct.
The duct material influences the current rating of a cable, depending on the thermal resistivity, but not very significantly because the duct wall thickness is relatively thin.
As the duct size increases (for the same cable size), so does the current rating. This is due to the reduced external thermal resistivity experienced by the cables, caused by the reduced temperature of the air enclosed in the duct.
Exposure to direct solar radiation
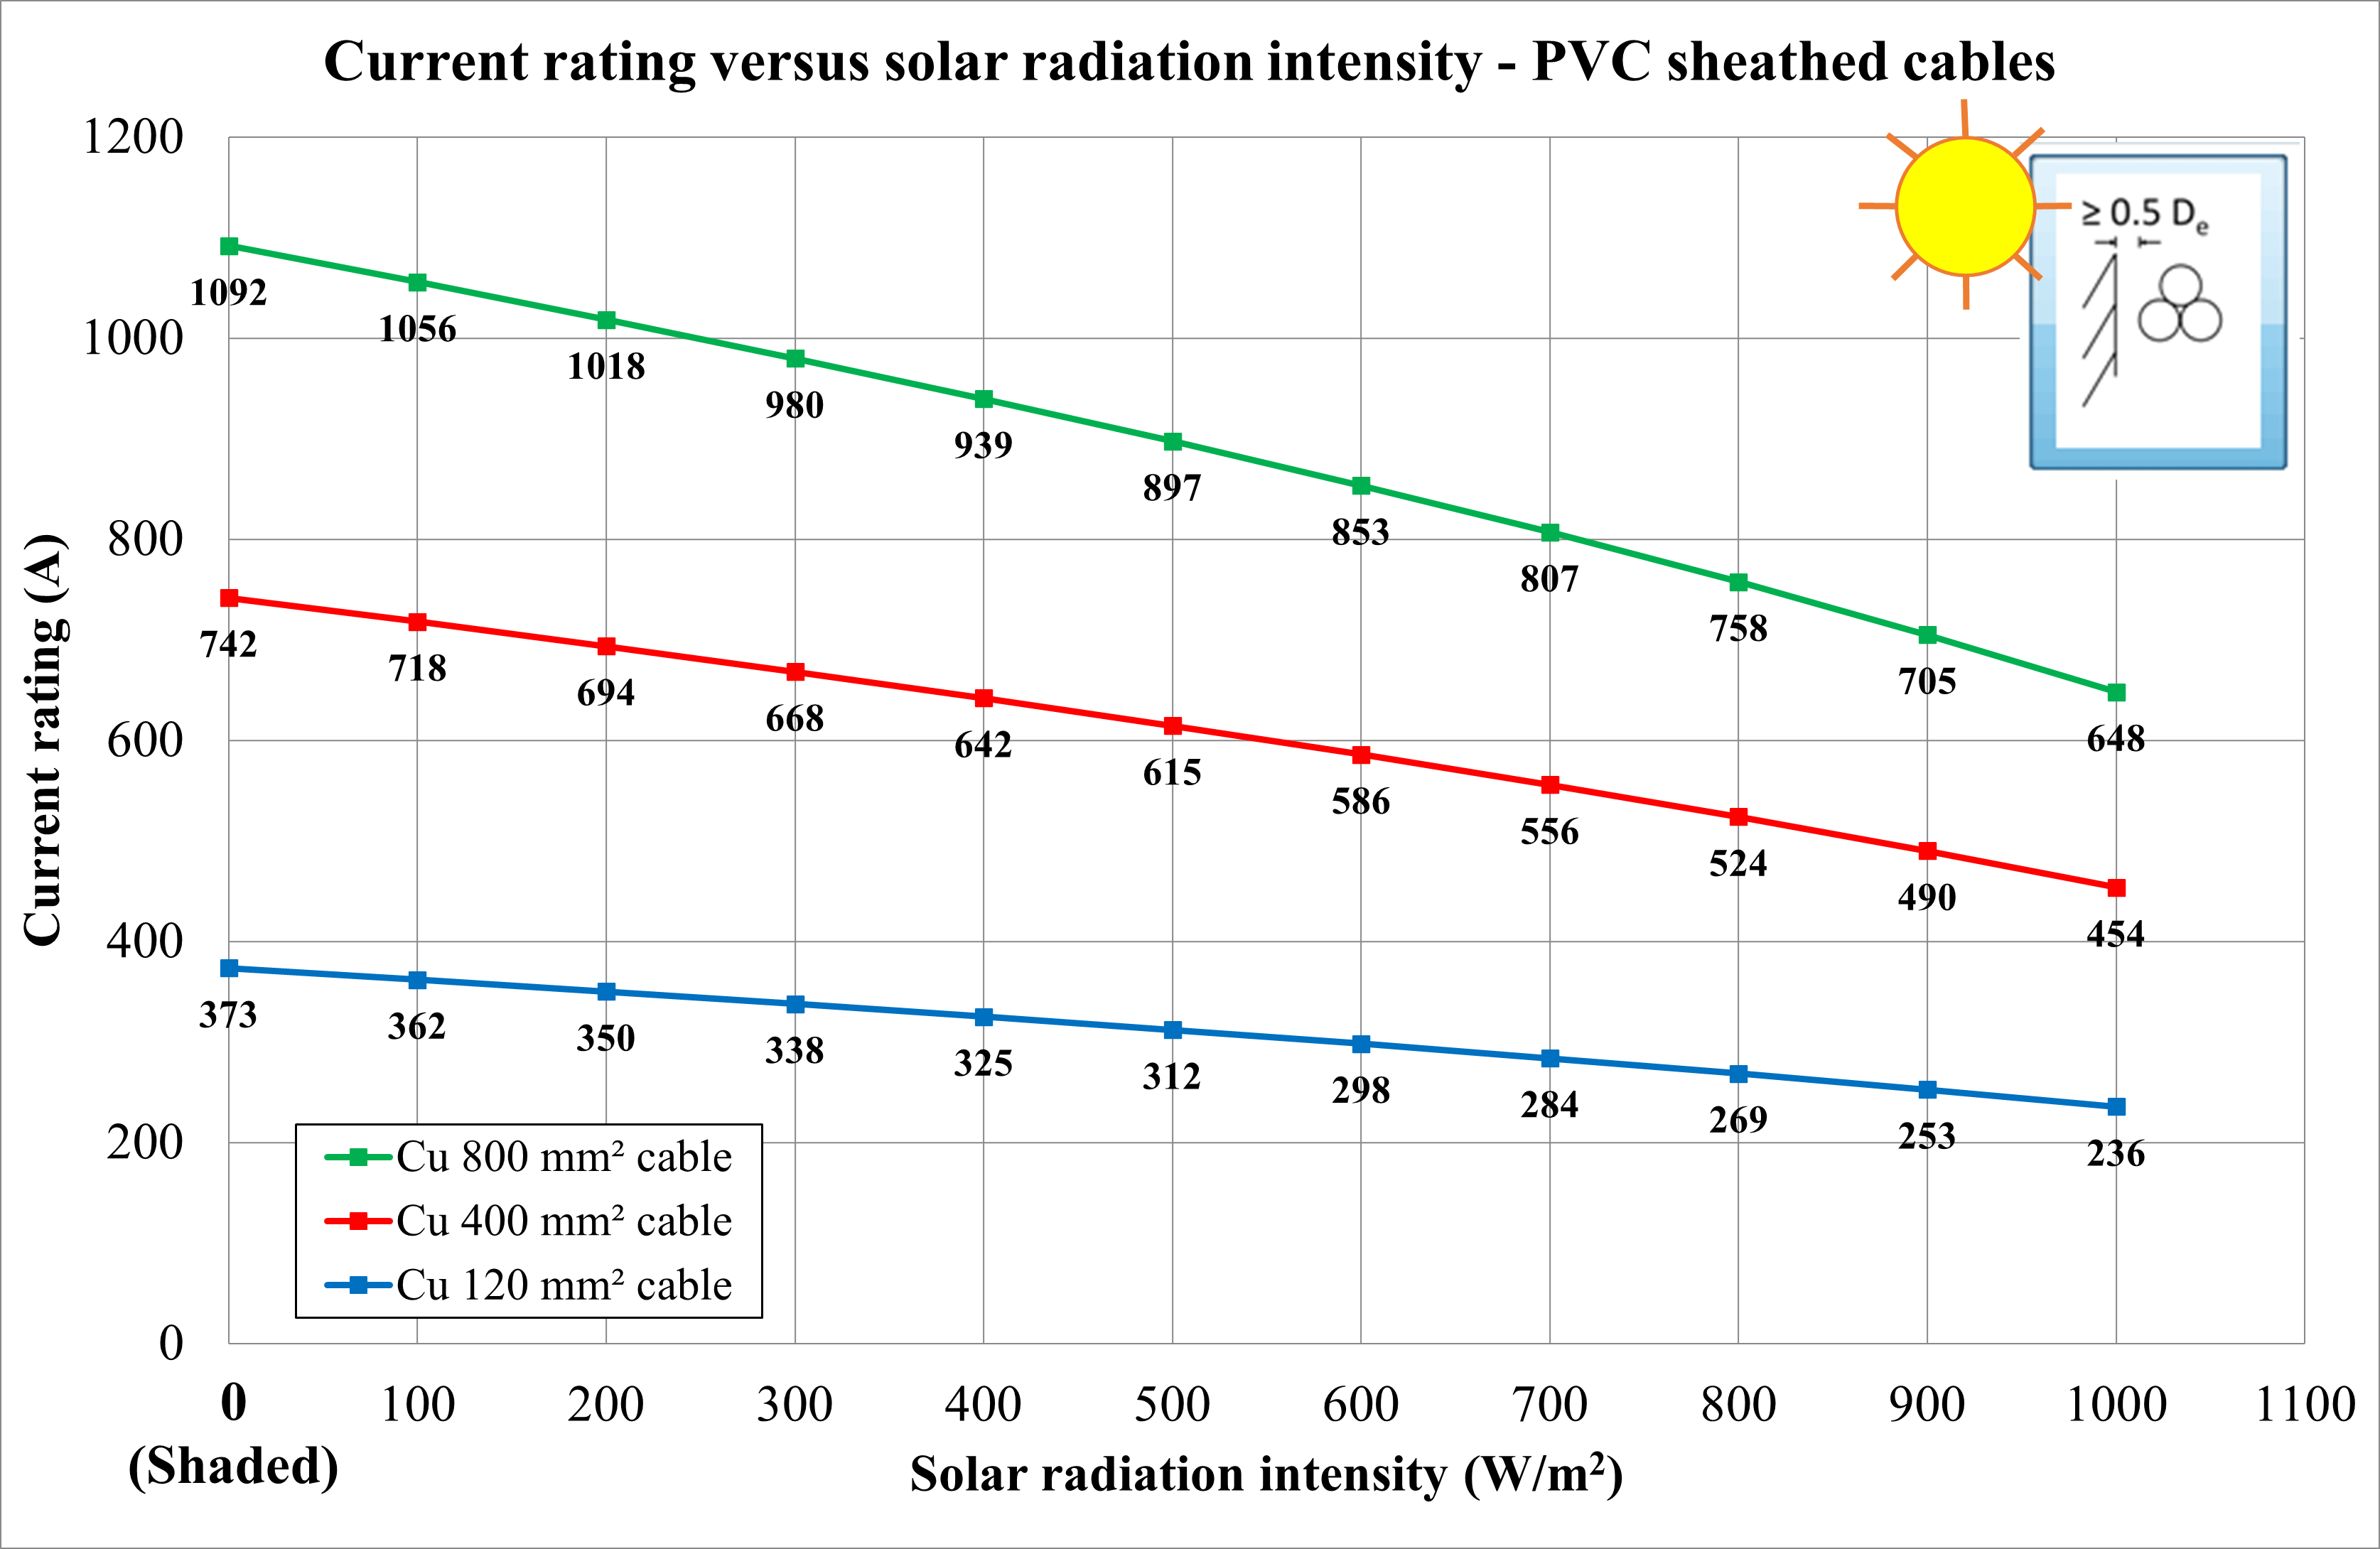
Cables of different sizes were modelled as exposed to direct solar radiation, and the intensity was varied from 0 W/m2 (shaded) up to 1000 W/m2. IEC 60287-3-1 states that when no information about the intensity of solar radiation is available, a value of 1000 W/m2 should be adopted. The surface absorption coefficient depends on the material type of the outer cable sheath. Below is a list of the observations from Figure 4.
Exposure to direct solar radiation increases the operating temperature, reducing the current rating of cables installed in the air.
The slope of the plots shows that the current rating is reduced more for larger (greater surface area) cables than for smaller (less surface area) cables.
The angle of the surface (exposed to solar radiation)
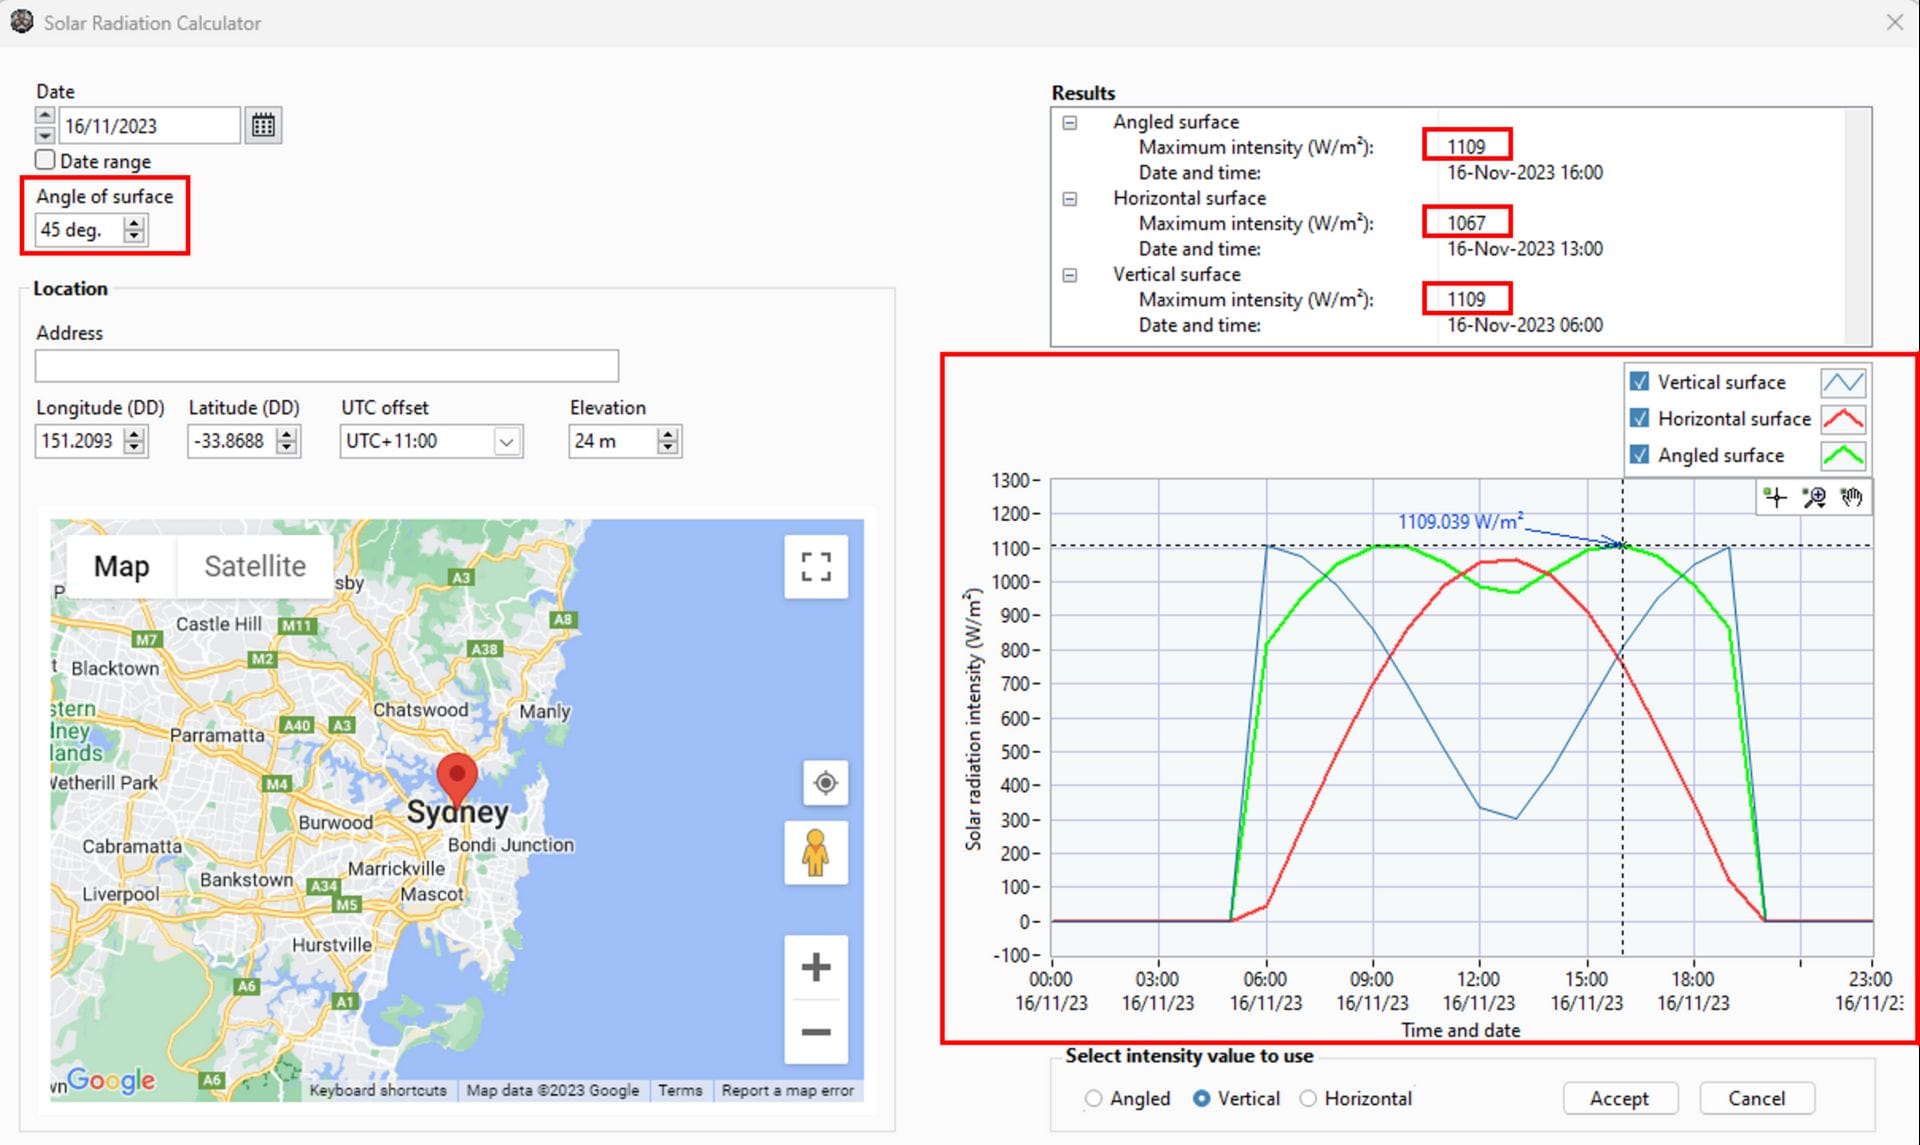
The solar radiation intensity depends on the geographical location (latitude and longitude), the day of the year, and the hour of the day. The solar radiation intensity experienced on an angled (45 degrees), horizontal, and vertical (cable) surface was calculated for 24 hours. Below is a list of the observations from Figure 5.
The intensity varies throughout the day as the position of the sun changes.
The solar intensity is generally highest when the sun is perpendicular to the surface.
The maximum solar radiation intensity throughout the day is little affected by the angle of the surface.
The peak solar radiation intensity occurs for a vertical cable surface during sunrise and sunset.
The peak solar radiation intensity occurs at midday for a horizontal cable surface.
The peak solar radiation intensity depends on the surface angle for an angled cable surface.
The average solar radiation intensity is higher for an angled (45-degree) surface than the horizontal or vertical cable surface.
Groups of cables in air
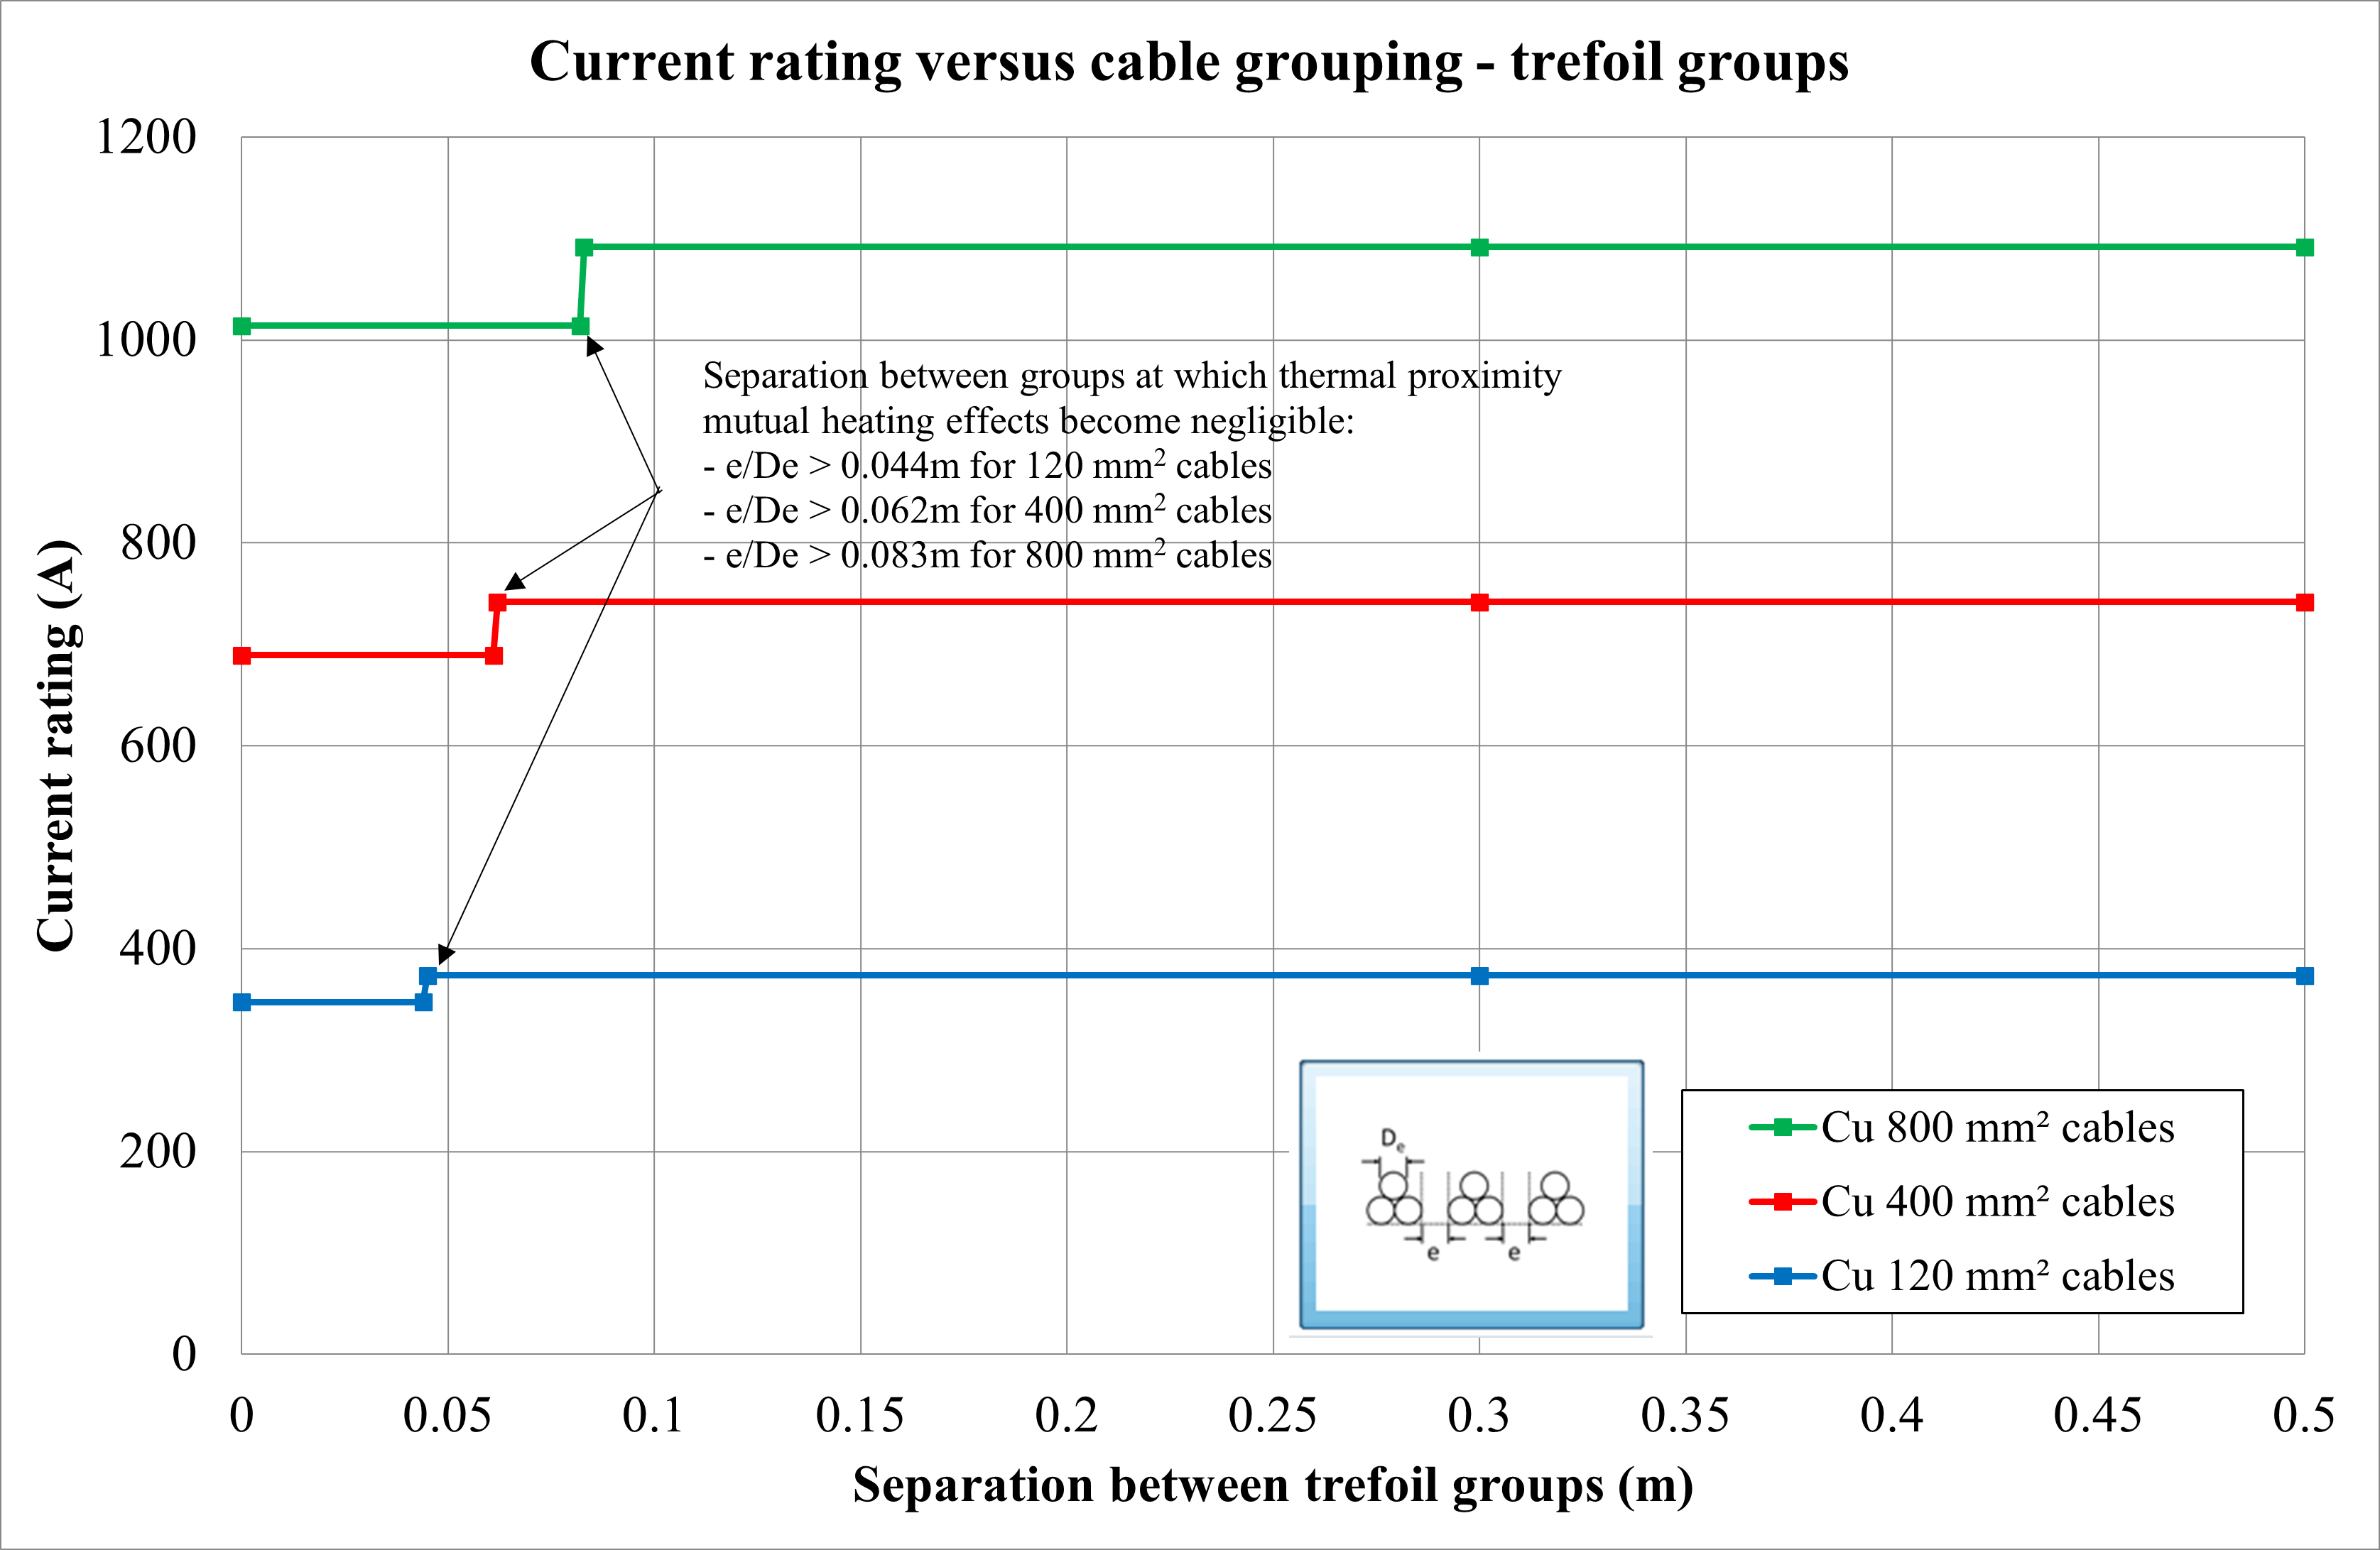
When cables are installed in groups in the air, the rating of the hottest cable will be lower than when the same cable is installed in isolation. This reduction is caused by mutual heating. Below is a list of the observations from Figure 6.
The effects of grouping in the air on current ratings depend on the cable diameter (De) ratio and the separation between circuits (e).
If the separation between groups exceeds the critical ratio of e/De, then the thermal proximity effects, which cause the de-rating of the circuits, can be neglected.
Buried cables
Varying conductor sizes and soil dry-out
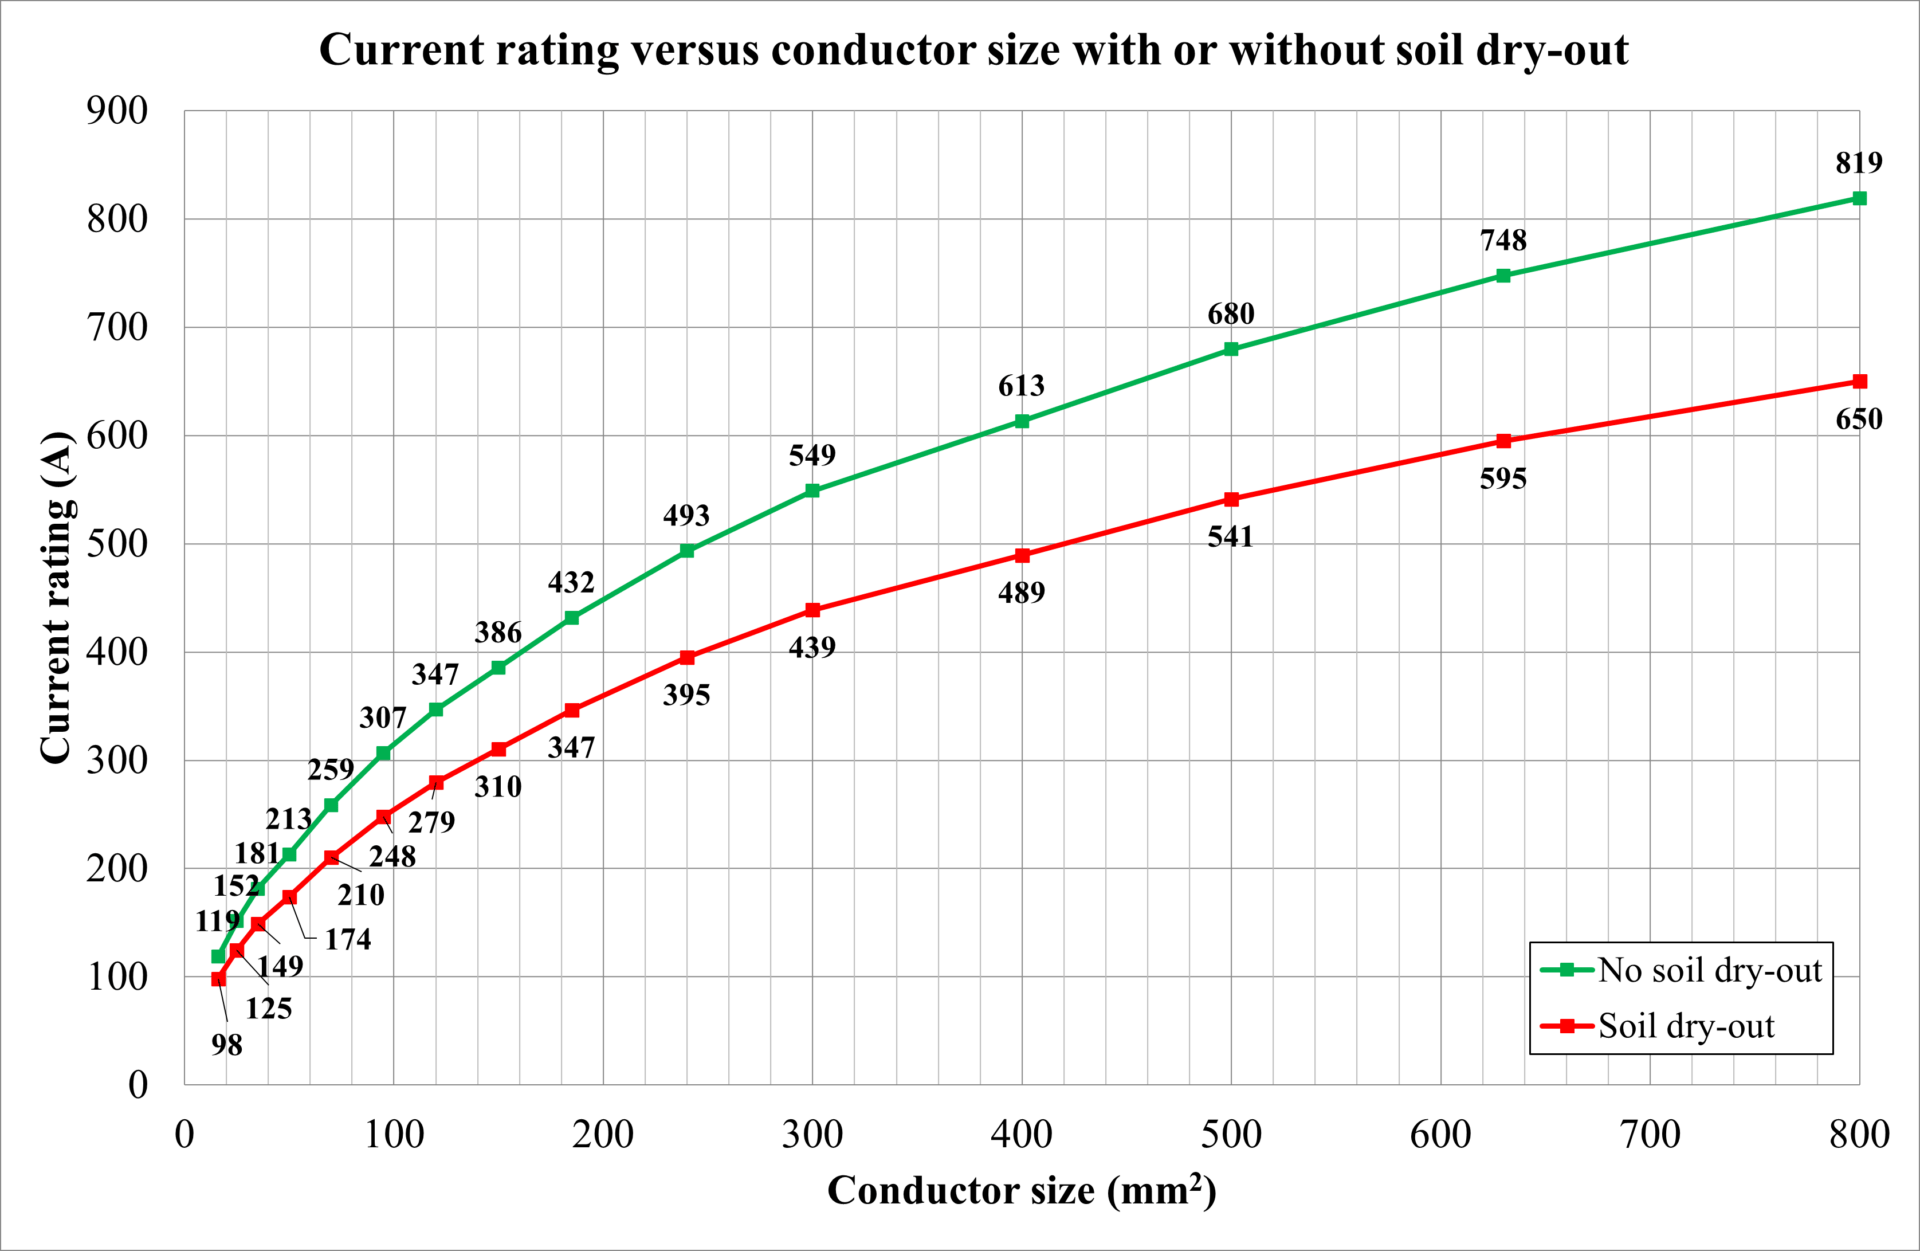
The conductor size has been varied from 16 mm2 up to 800 mm2. Cables are modelled as directly buried in a trefoil and touching arrangement. The phenomenon of soil dry-out requires an explanation. Soil thermal resistivity is not constant and is highly dependent on soil moisture content. As soil heats up caused by the loading of the cables, moisture may tend to migrate away from the cable surface. A dried-out soil zone can develop around the cables in which the thermal resistivity is increased. This, in turn, tends to increase the cables’ temperature, reducing their ratings.
A two-zone model for the soil surrounding loaded cables addresses the complex effect of moisture migration on cable rating calculations. The concept of the model is summarised as follows. Moist (native) soil is assumed to have a uniform thermal resistivity; however, if the heat dissipated from a loaded cable and its surface temperature is raised above a certain critical temperature, then the soil immediately surrounding the cable will dry out resulting in a zone which is assumed to have a higher uniform thermal resistivity.
Below is a list of the observations from Figure 7.
The increase in current rating with conductor size is more non-linear, and the current ratings are lower for cables in soil compared with cables in air.
Soil thermal resistivity
Soils composed of clay or peat have resistivities as low as 0.8 °C.m/W, while fast-draining sands may have resistivities of 2.5 °C.m/W. Ground composed of building rubble and, as such, has air gaps and may have a resistivity higher than 3 °C.m/W.
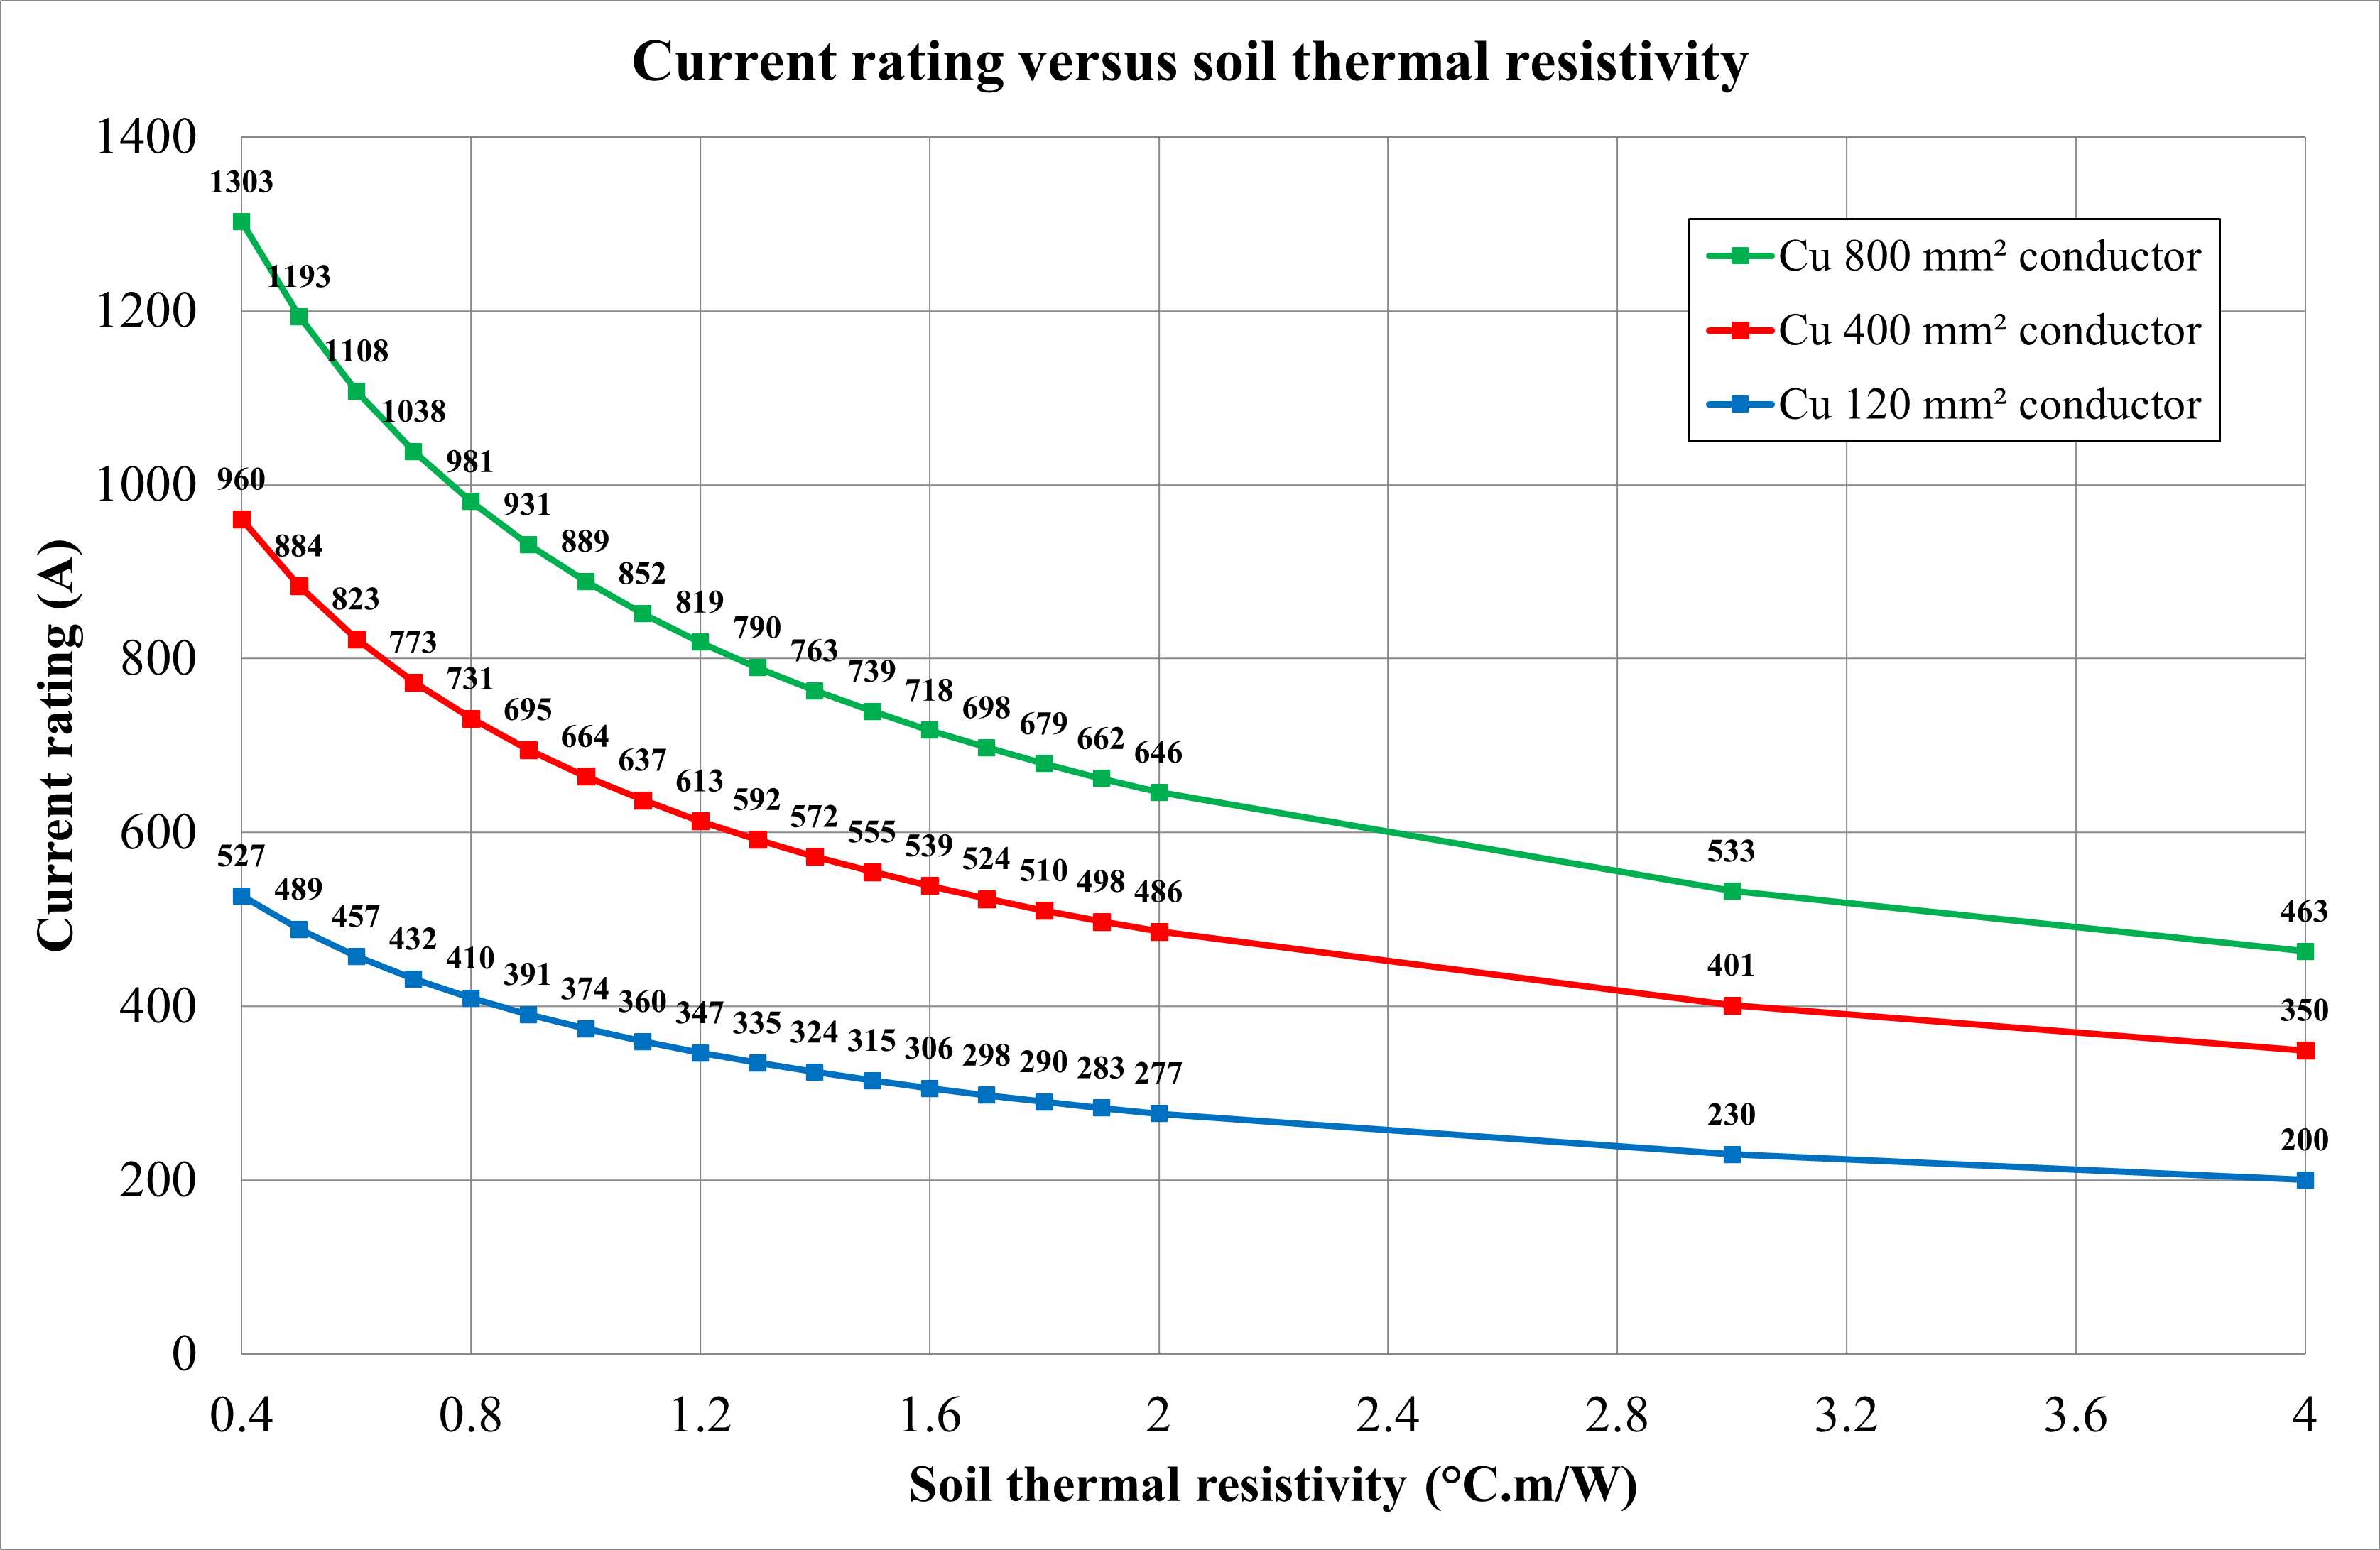
The thermal resistivity of the native soil for directly buried cables laid in a flat and touching arrangement was varied from 0.4 up to 4.0 °C.m/W. Below is a list of the observations from Figure 8.
The current rating of cables is highly dependent on and reduces significantly (more for larger cables) with increasing soil thermal resistivity and follows a hyperbolic function.
Ambient soil temperature
The ambient soil temperature affects the cable rating and depends on climatic and installation-specific factors. The ambient soil temperature can be measured or taken from relevant meteorological data sources. Applicable national standards specify the ambient temperatures at which cable ratings shall be calculated for your country or region; however, IEC 60287-3-1 may be referred to where these are unavailable.
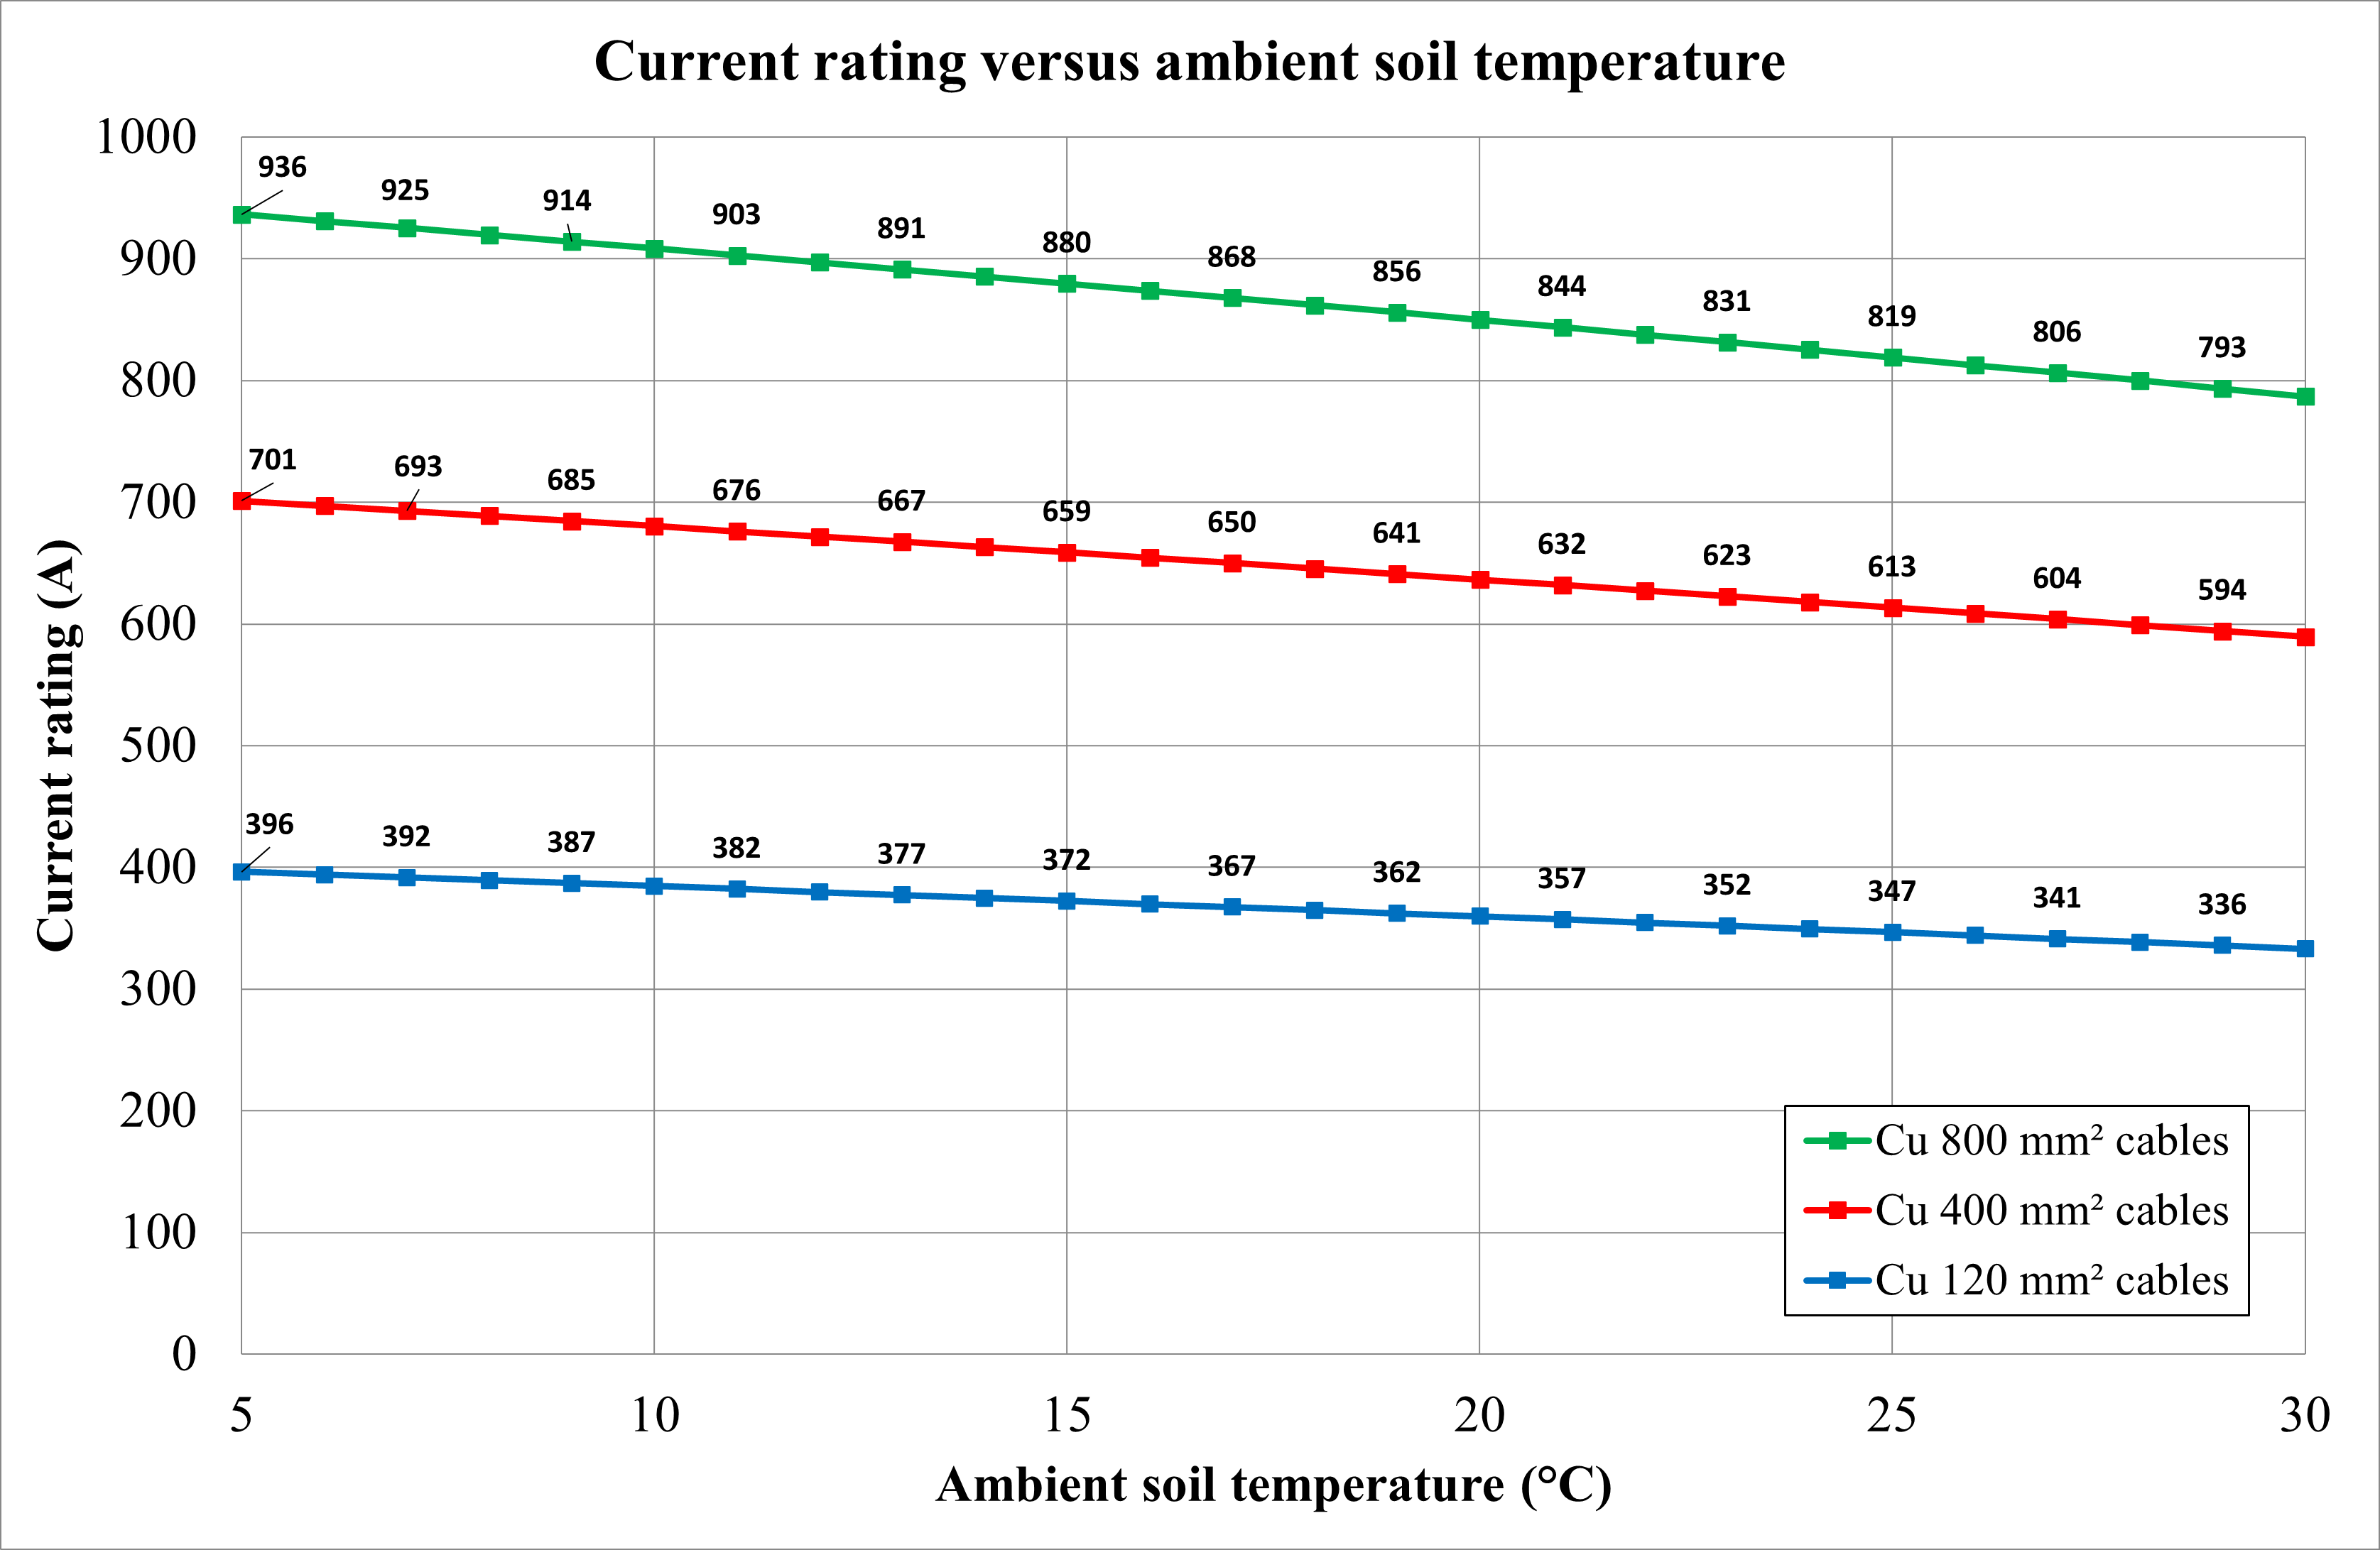
The ambient air temperature was varied between 5 ̊C and 30 ̊C for different cable sizes, and the current rating was calculated. Below is a list of the observations from Figure 9.
As soil ambient temperature increases, the cable current rating decreases linearly.
Due to surface area, the drop in current rating is greater for larger cables than for smaller cables.
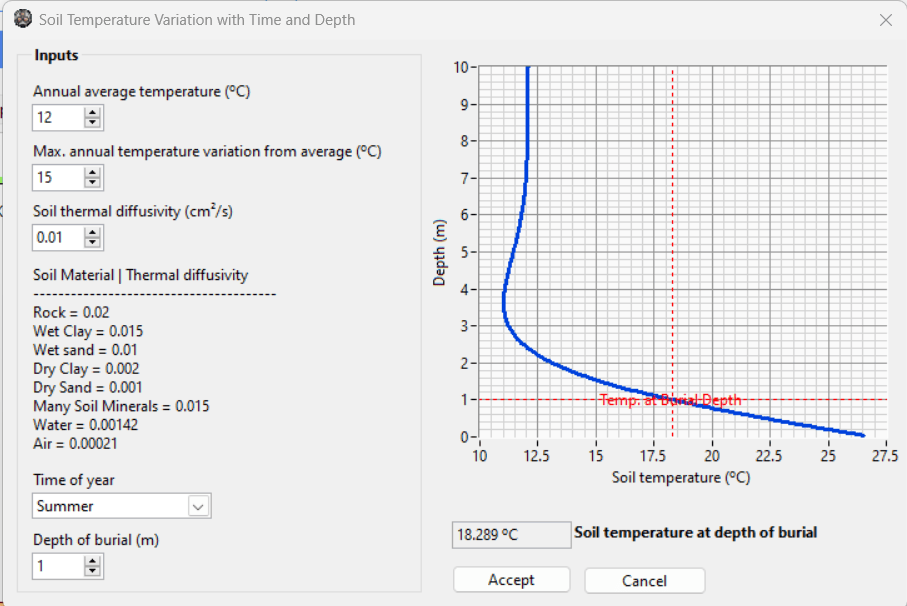
It is often commercially advantageous, particularly when burying cables at depths greater than 1 metre, to consider and propose to your client to use expected soil ambient temperature and not a conservative value such as 25 °C from the standards. The expected average soil ambient temperature can be calculated based on the following data:
- Annual average temperature.
- Maximum annual temperature variation from average.
- Soil thermal diffusivity (inertia).
- Time of year.
- Depth of burial.
For example, in a particular installation in a moderate climate, the average annual temperature is 12 °C, and the maximum is 35 °C. Therefore, the maximum annual temperature variation is 23 °C. The soil composition resembles wet sand; the thermal diffusivity is 0.01 cm2/s. The anticipated depth of burial of cables is 1 metre. Figure 10 shows that at a depth of 1 metre in summer, the soil temperature is 21.64 °C. As can be seen, as the burial depth approaches infinity, the soil’s ambient temperature approaches the average ambient temperature.
Touching and non-touching cables
When cables are touching or laid near each other, the heat flux of a cable will be distorted by that of other nearby cables. This distortion becomes significant with cables spaced by less than two cable diameters. For this reason, the empirical equations given by the IEC 60287 Standard for touching cables differ from those for spaced cables, the latter of which was originally derived using the finite element method to account for the heat flux distortion.
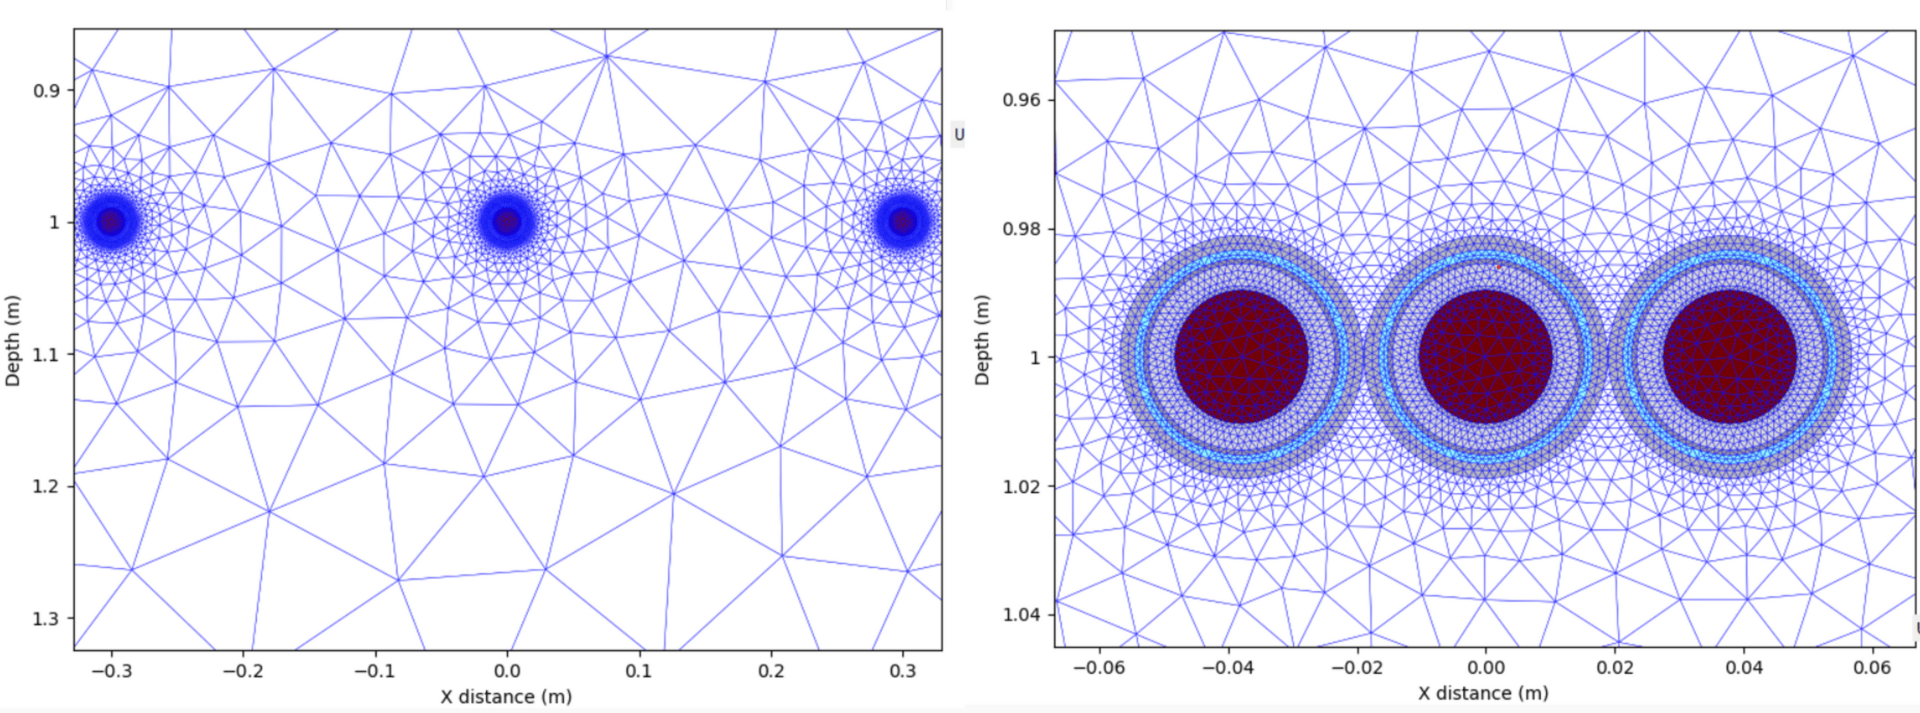
Heat emanates radially from the conductor, the hottest component and the main heat source inside the cable. The heat fields for both touching and spaced cables are shown in Figure 11 and were calculated using the finite element method. The meshed layouts are given in Figure 12, where the hottest points on the outer surfaces of the cables (caused by the mutual heating between cables) are indicated with yellow-coloured crosses.

Multiple buried cables
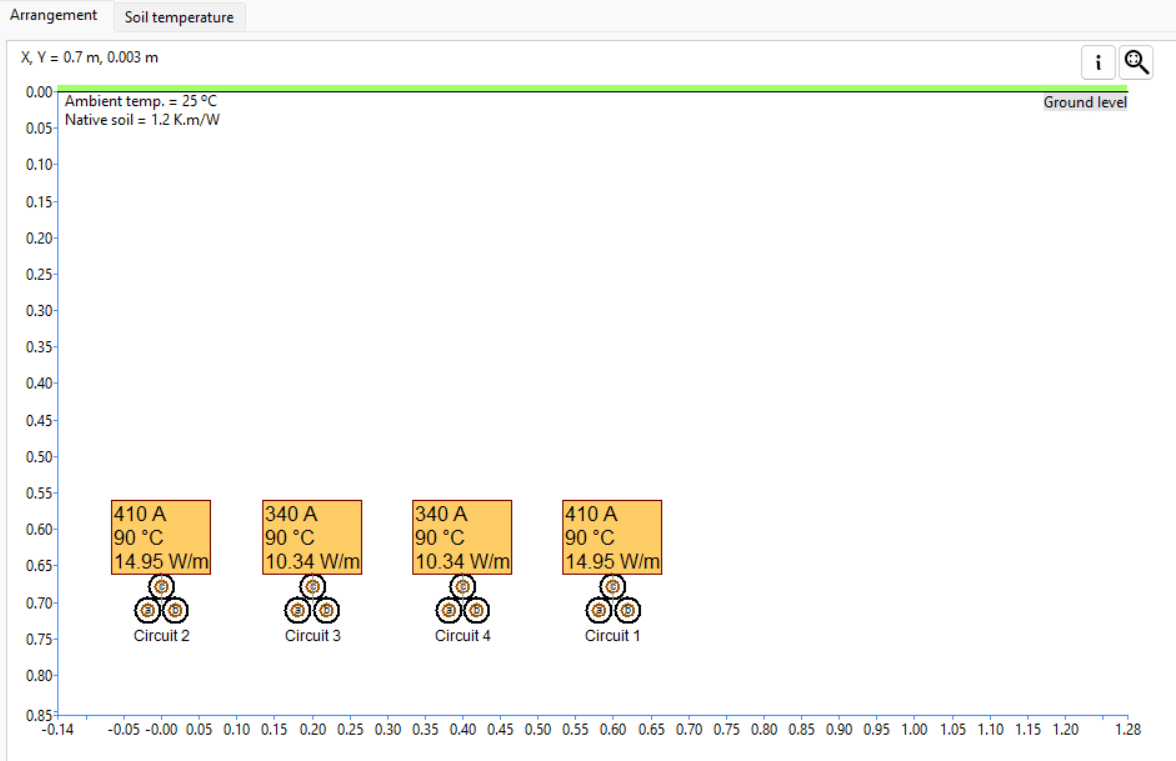
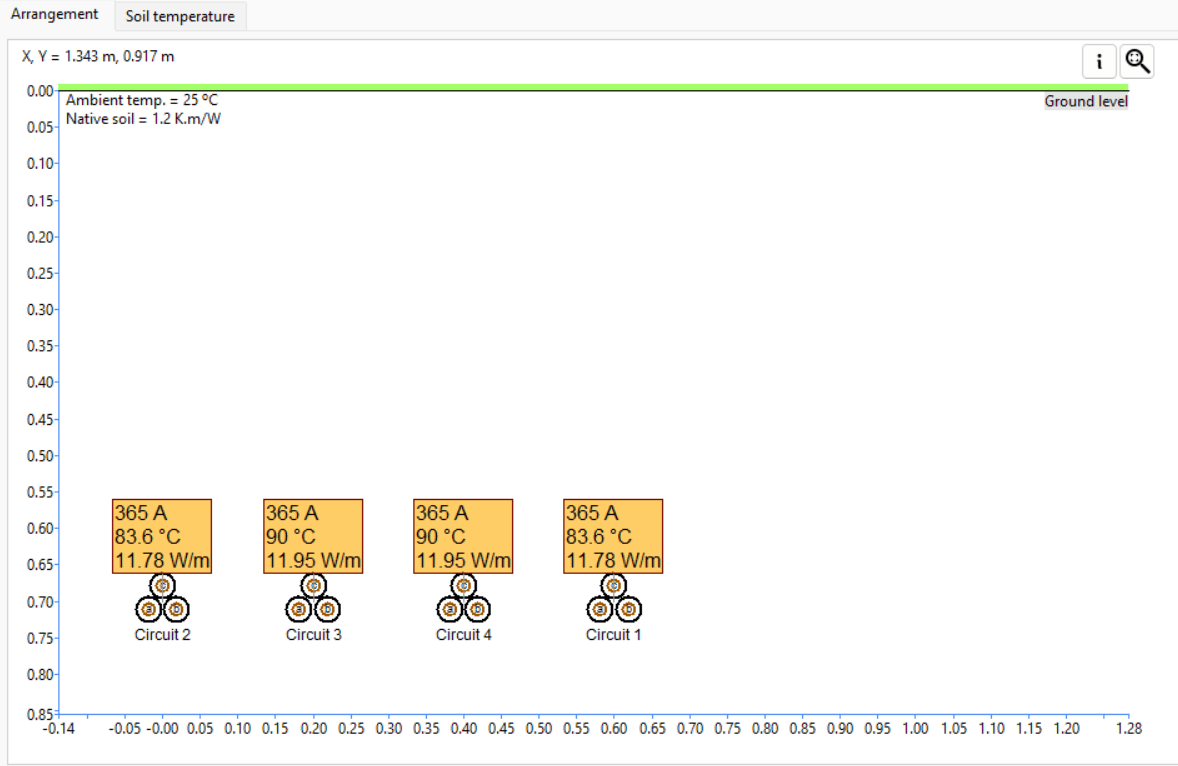
Often, multiple circuits are buried inside the same trench. Due to the mutual heating effects between the cables, the current rating of the circuits will be reduced. Since this scenario has infinite arrangements, there are no general rules. However, in general, the higher the number of circuits and the closer they are spaced, the more their current ratings are reduced due to the mutual heating. For example, Figure 13 shows four identical buried single-core trefoil circuits spaced 0.2 m from each other. Note that the isolated current rating for a single-core trefoil circuit is 540 A.
For unequally loaded circuits, the cable circuits in the middle of the arrangement have a higher degree of mutual heating and, thus, a lower current rating than the outer circuits, 340 A and 410 A, respectively.
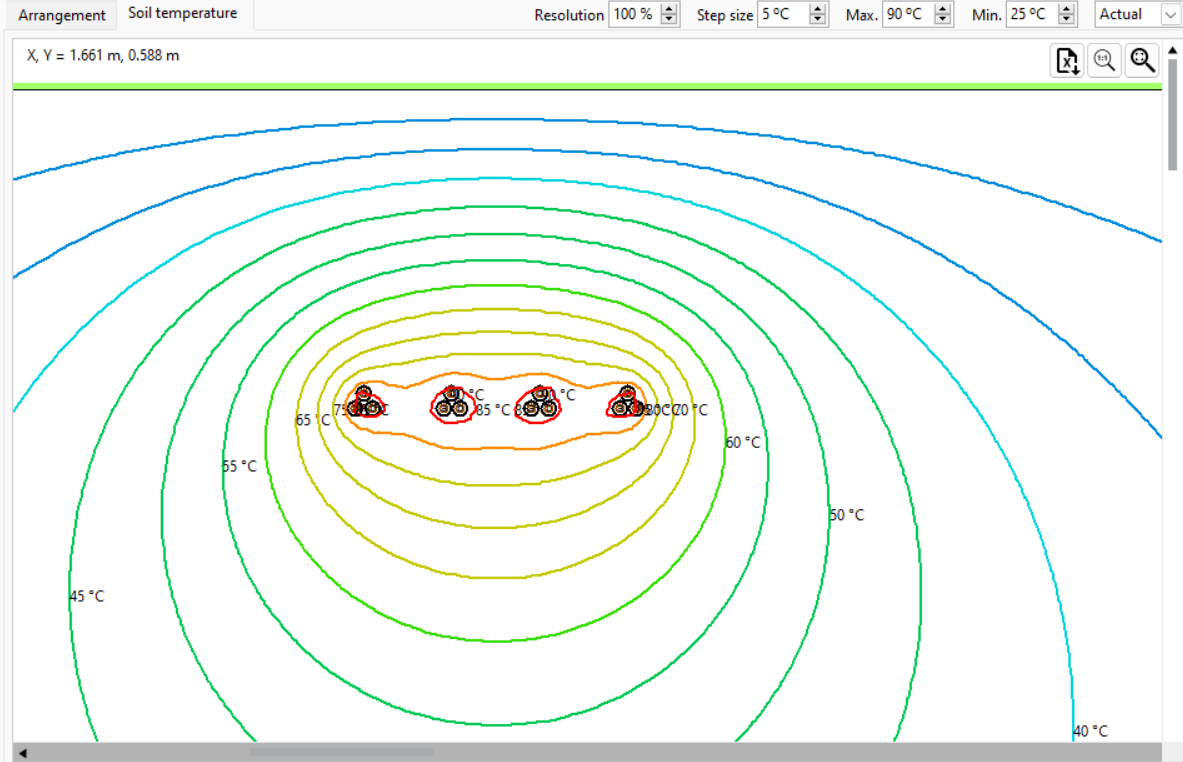
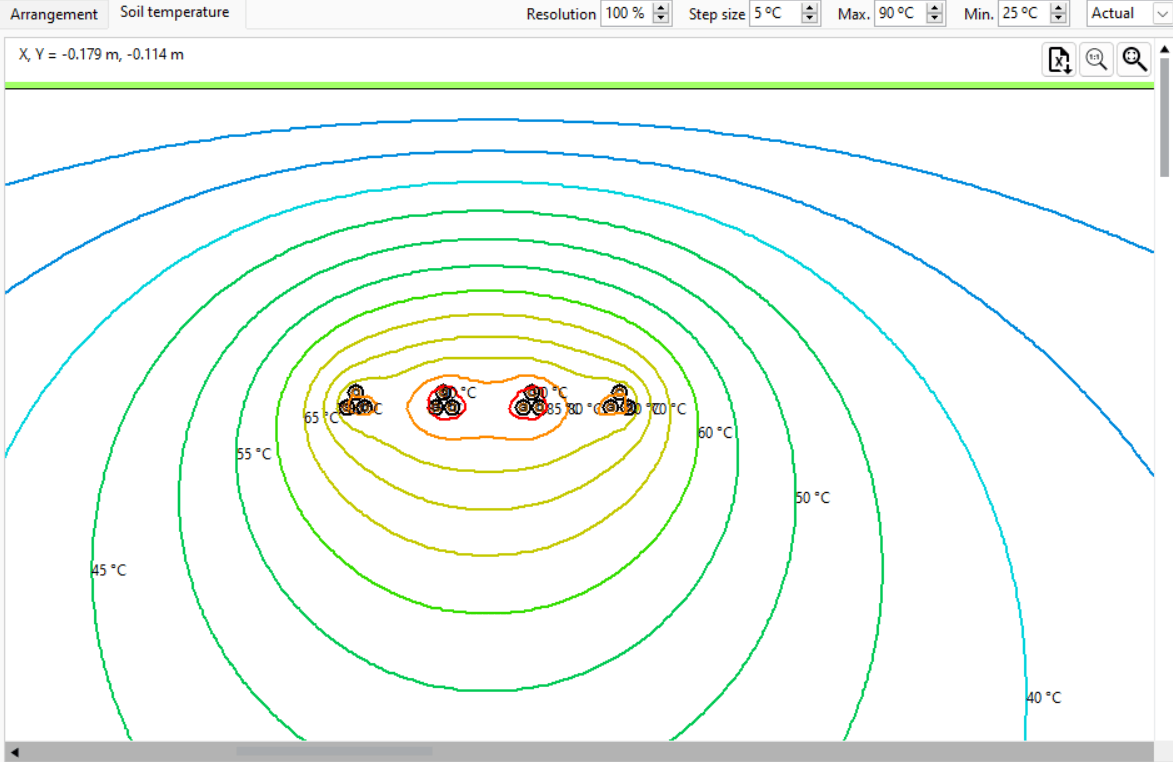
For identical trefoil circuits that are equally loaded, where mutual heating is considered, the current rating is reduced by 32.41 % to 365 A. The soil temperature plot is also shown.
Thermal backfills
To achieve the highest possible current rating for buried circuits, cables can be installed in an envelope of material with better thermal heat conduction properties than the native soil. This additional material is referred to as a thermal backfill. A typical arrangement is shown in Figure 17.
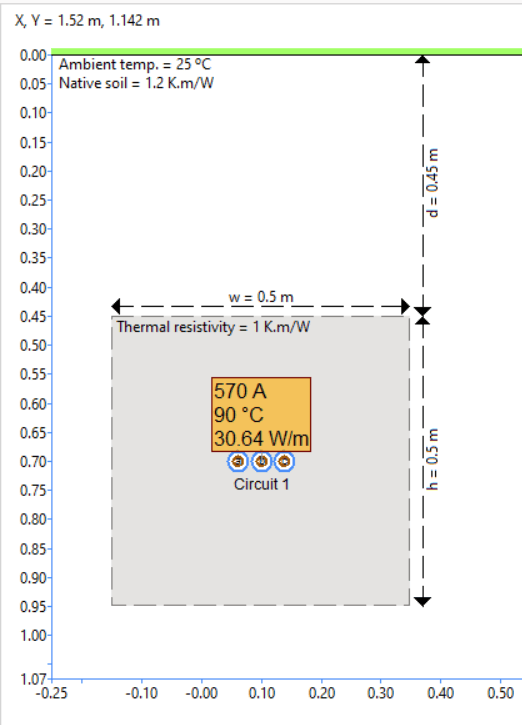
The level of compaction and grain size distribution determines the thermal resistivity of a backfill material. Backfill thermal resistivity should be known (through measurement) to be considered in a design.
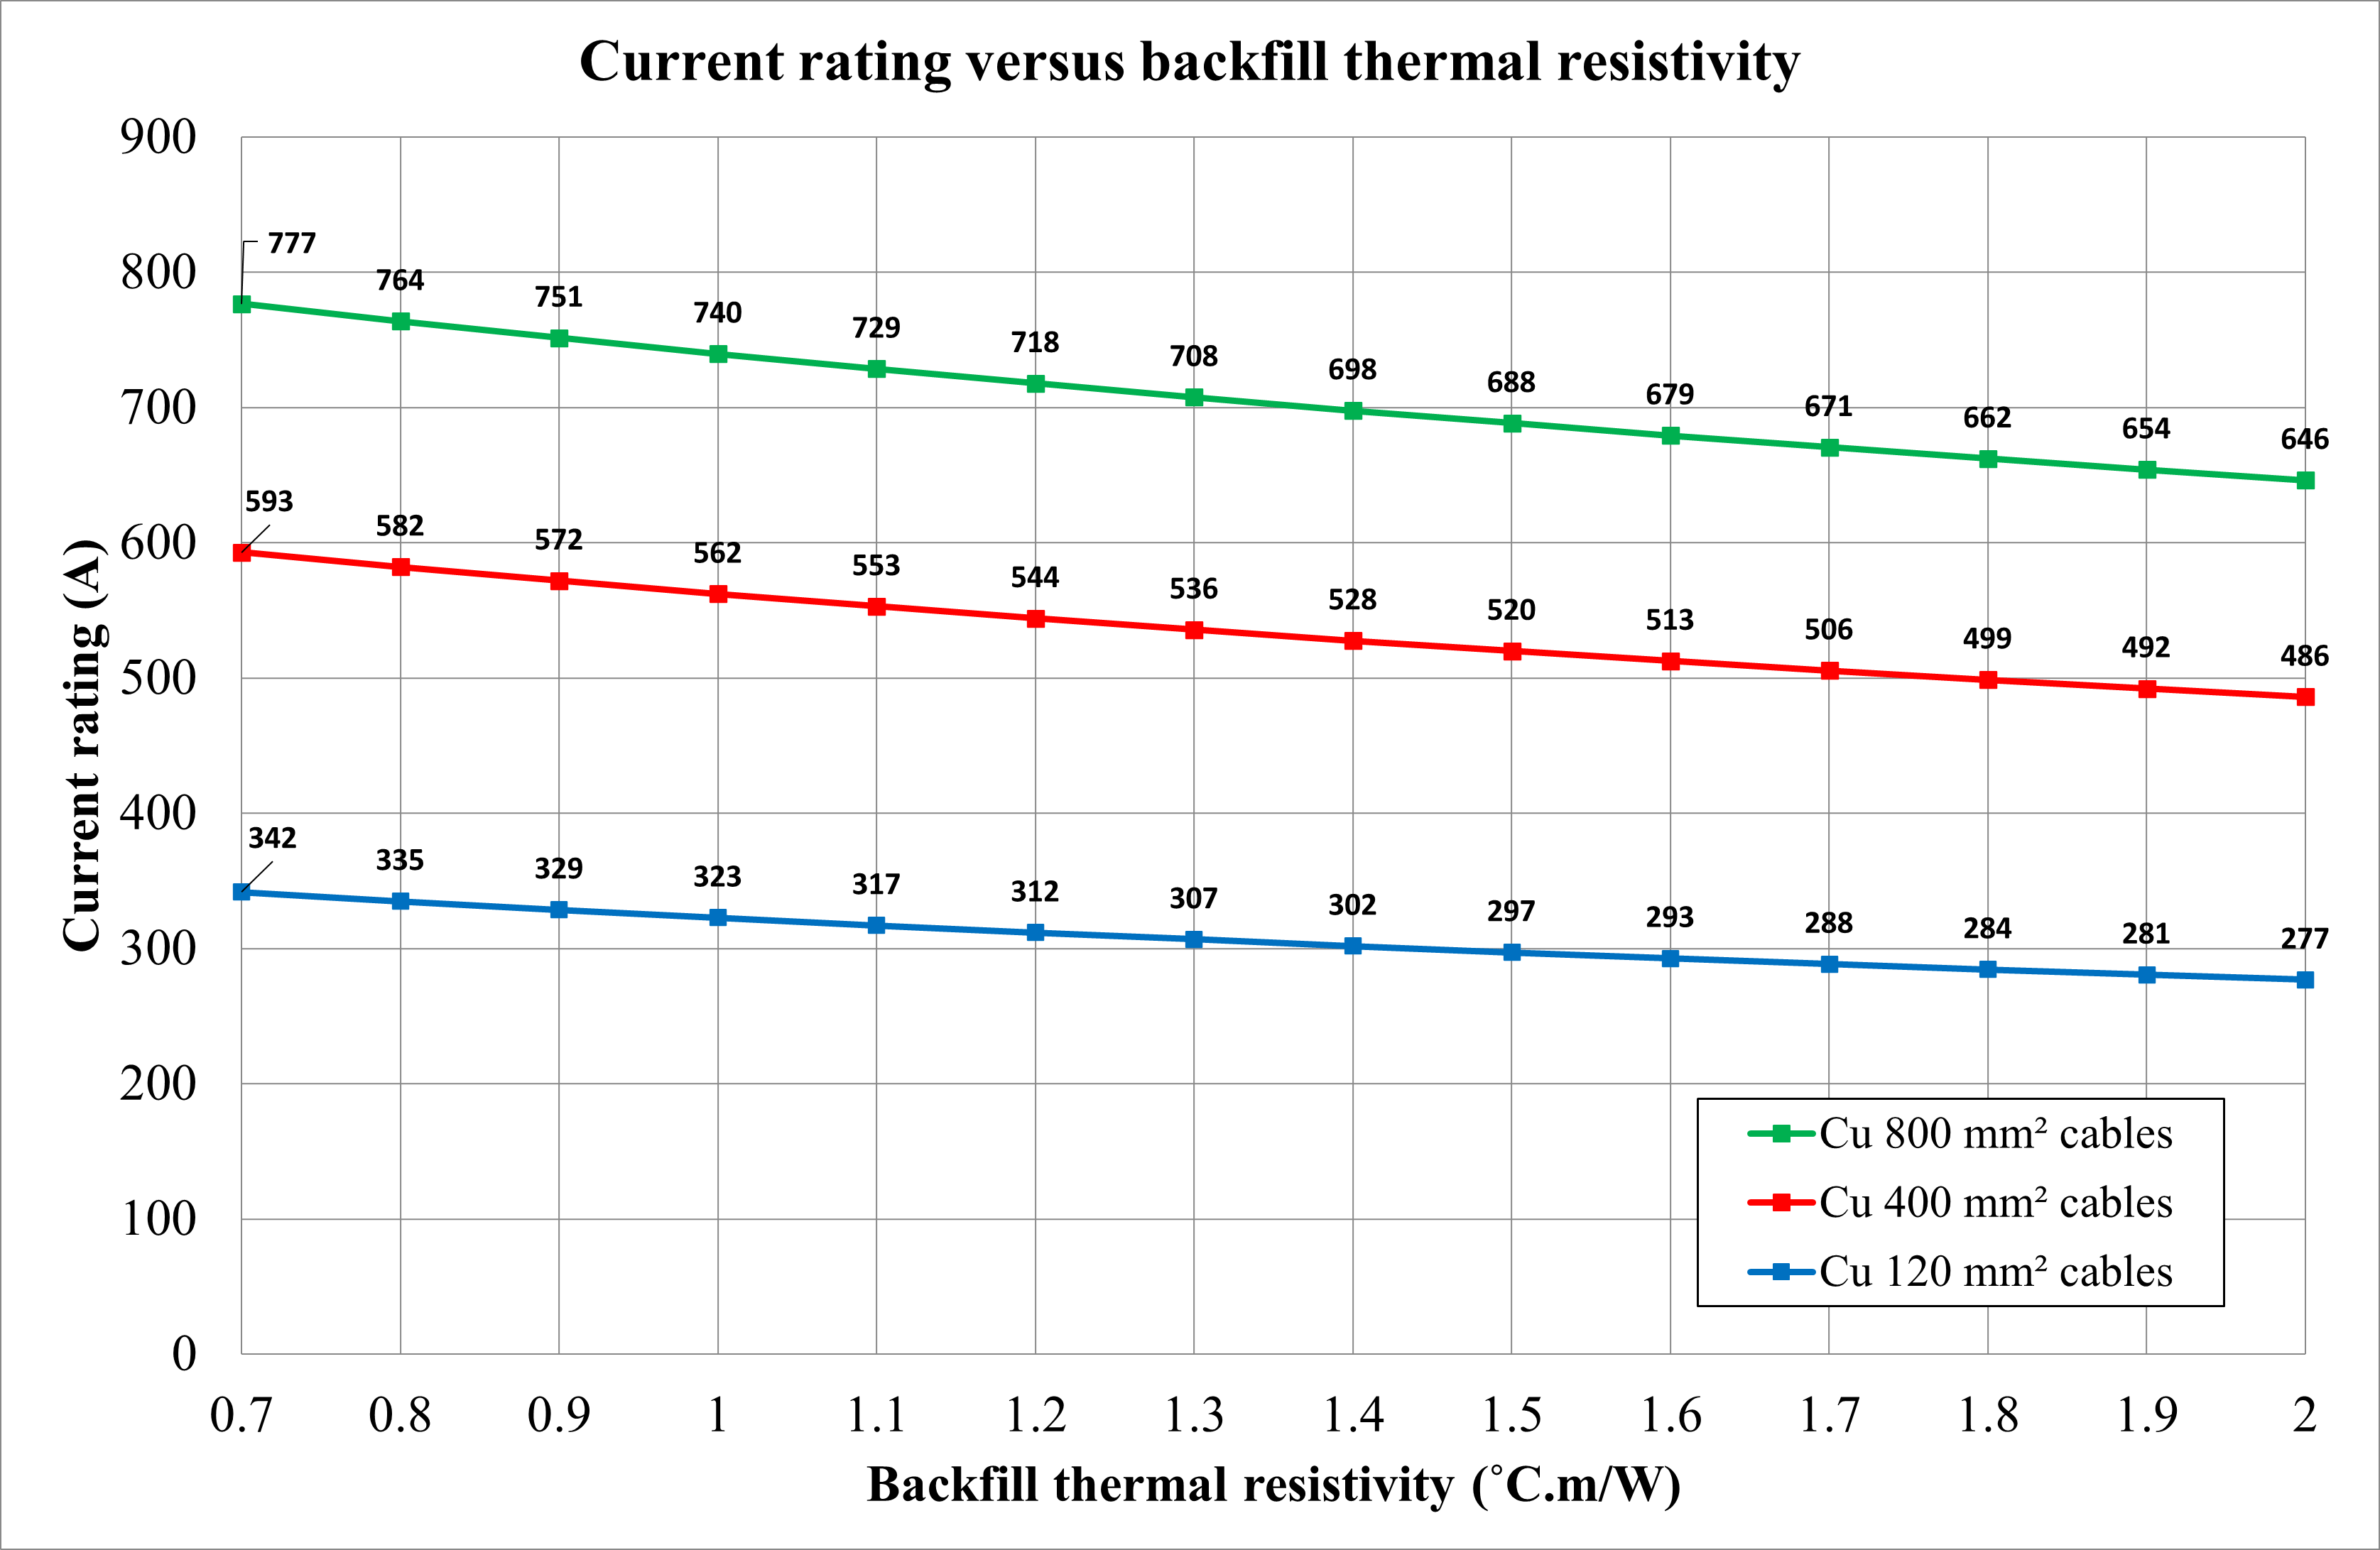
The native soil thermal resistivity was increased to 2 K.m/W, and the backfill thermal resistivity value varied from 0.7 K.m/W up to 2 K.m/W. Below is a list of the observations from Figure 18.
A lower thermal resistivity of the backfill improves the cable current ratings.
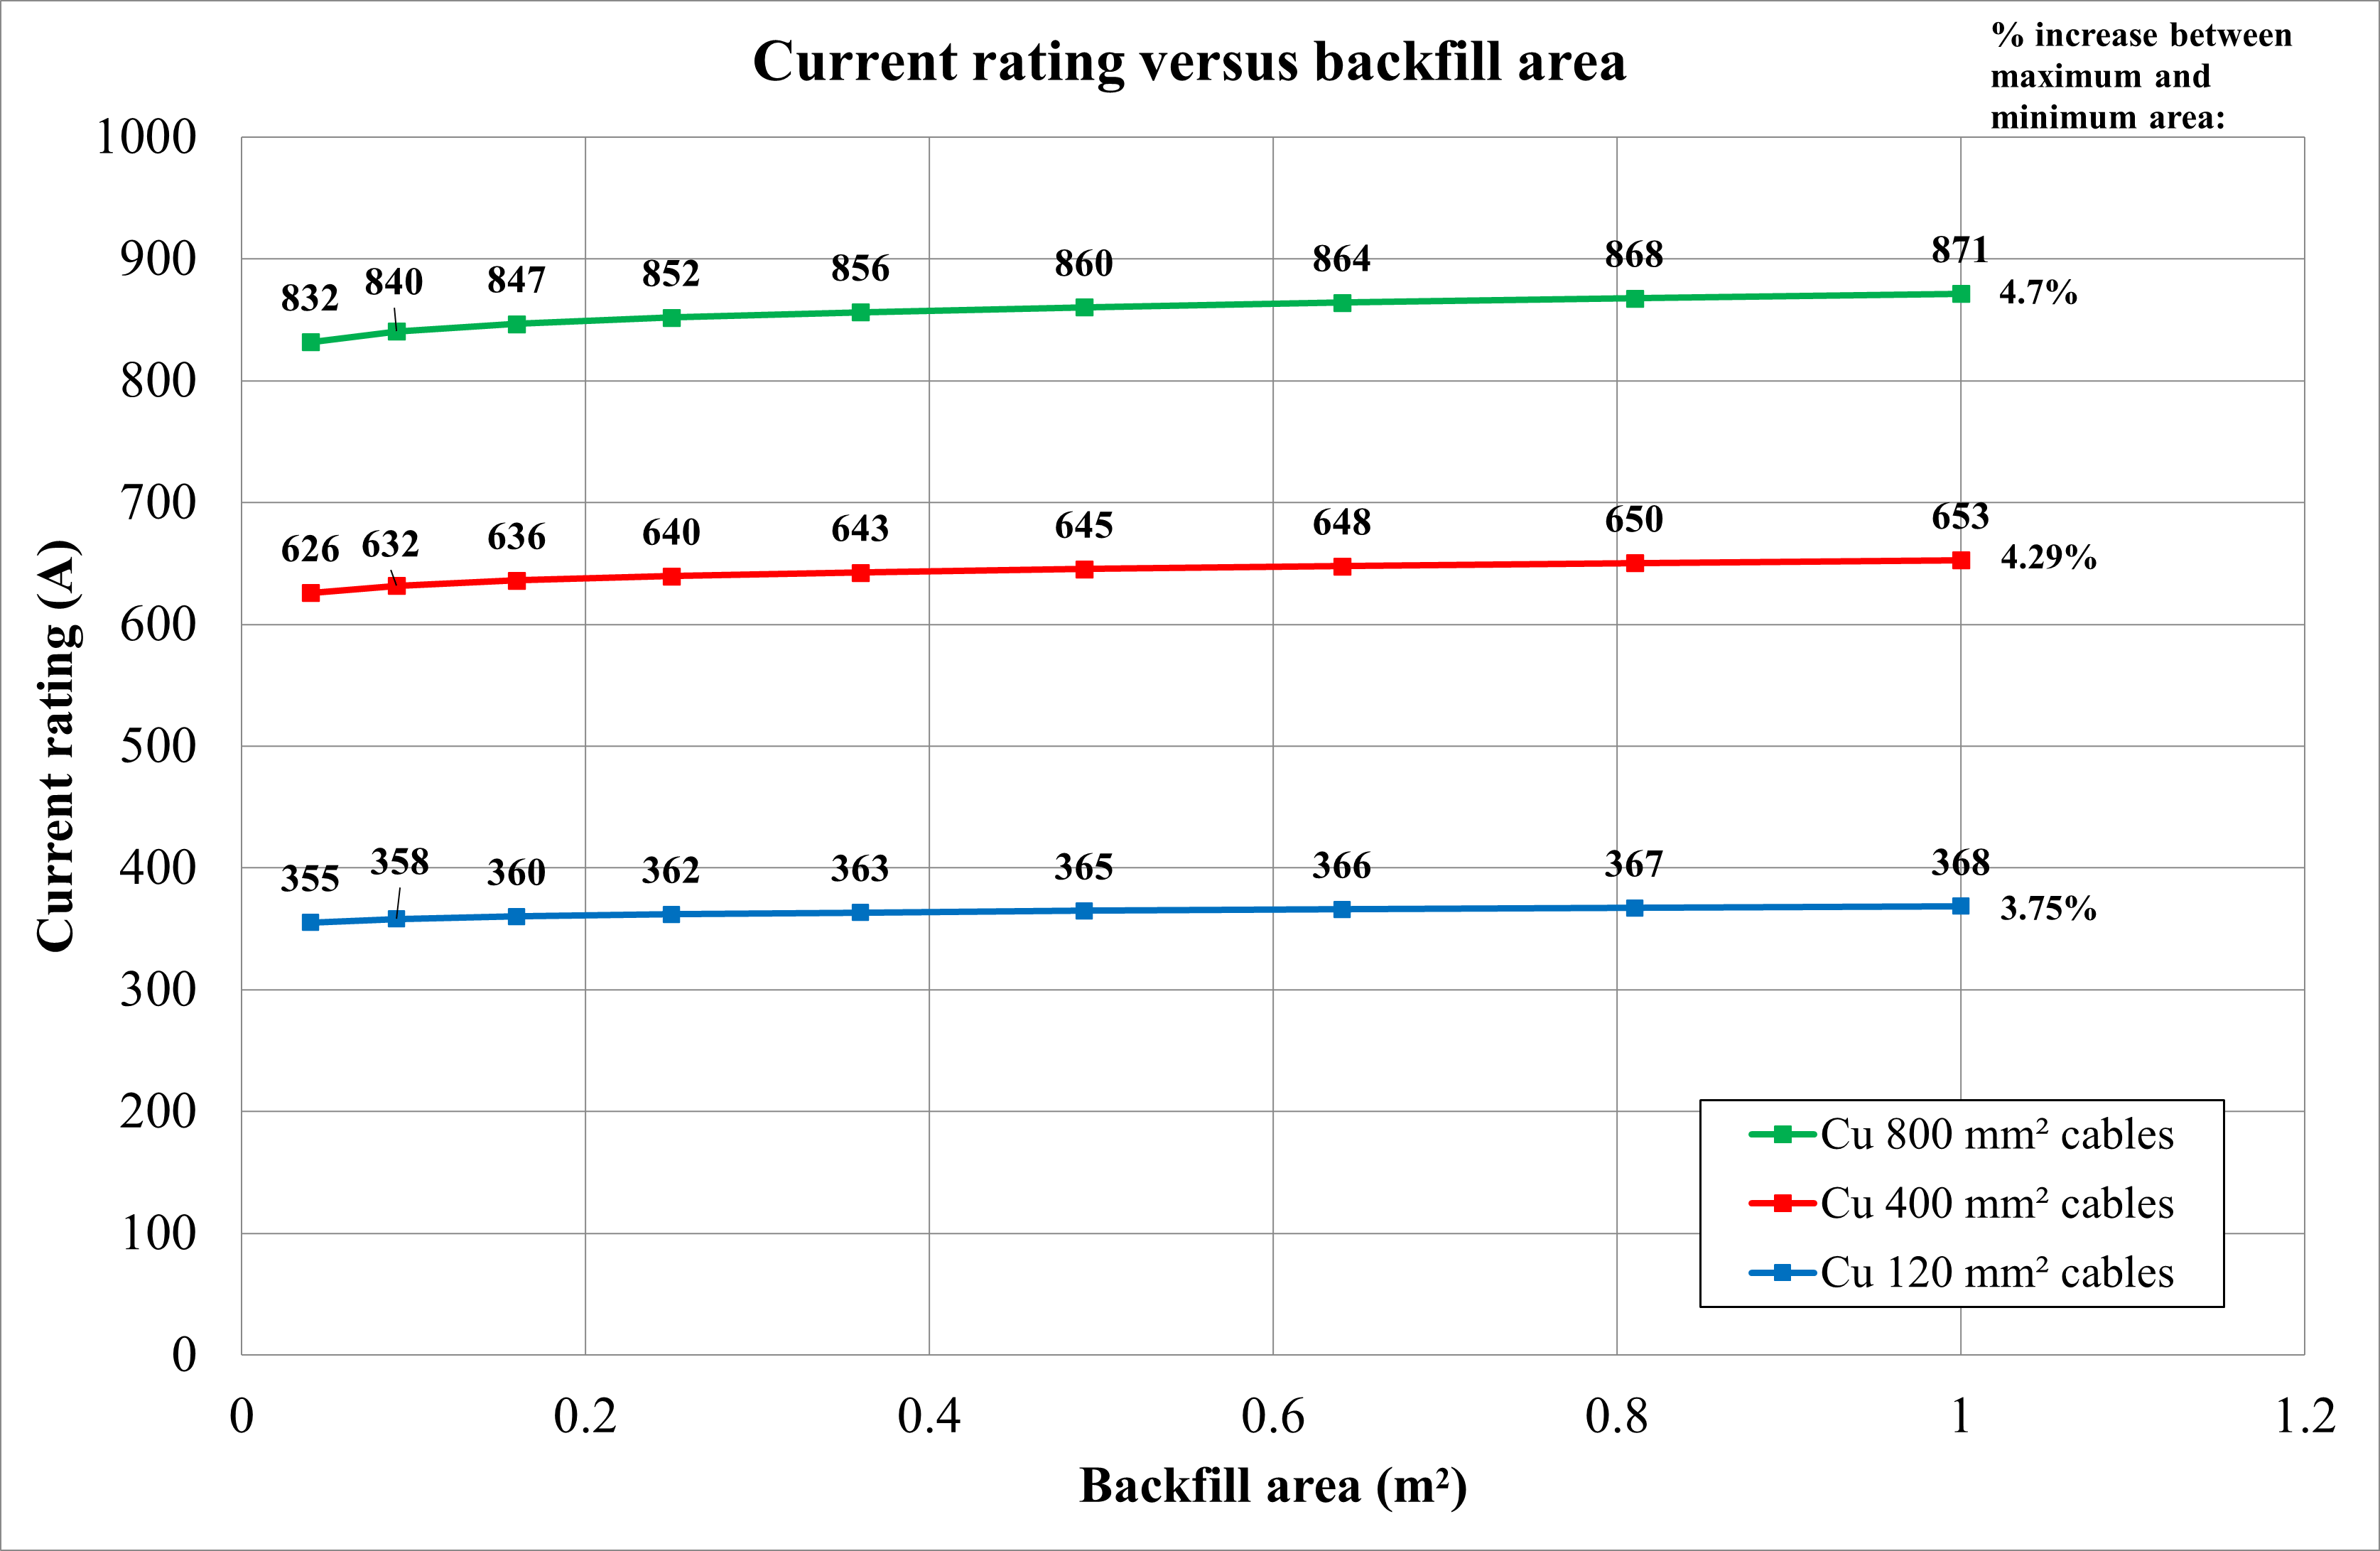
The overall dimensions of the thermal backfill also affect the cable current ratings. Below is a list of the observations from Figure 19.
As the backfill area increases, there is a marked increase in the current rating, but as the backfill area gets larger, this improvement diminishes.
It is often worthwhile to do a cost-benefit analysis of the savings due to improved current ratings and the additional costs associated with a backfill.
Varying load factor
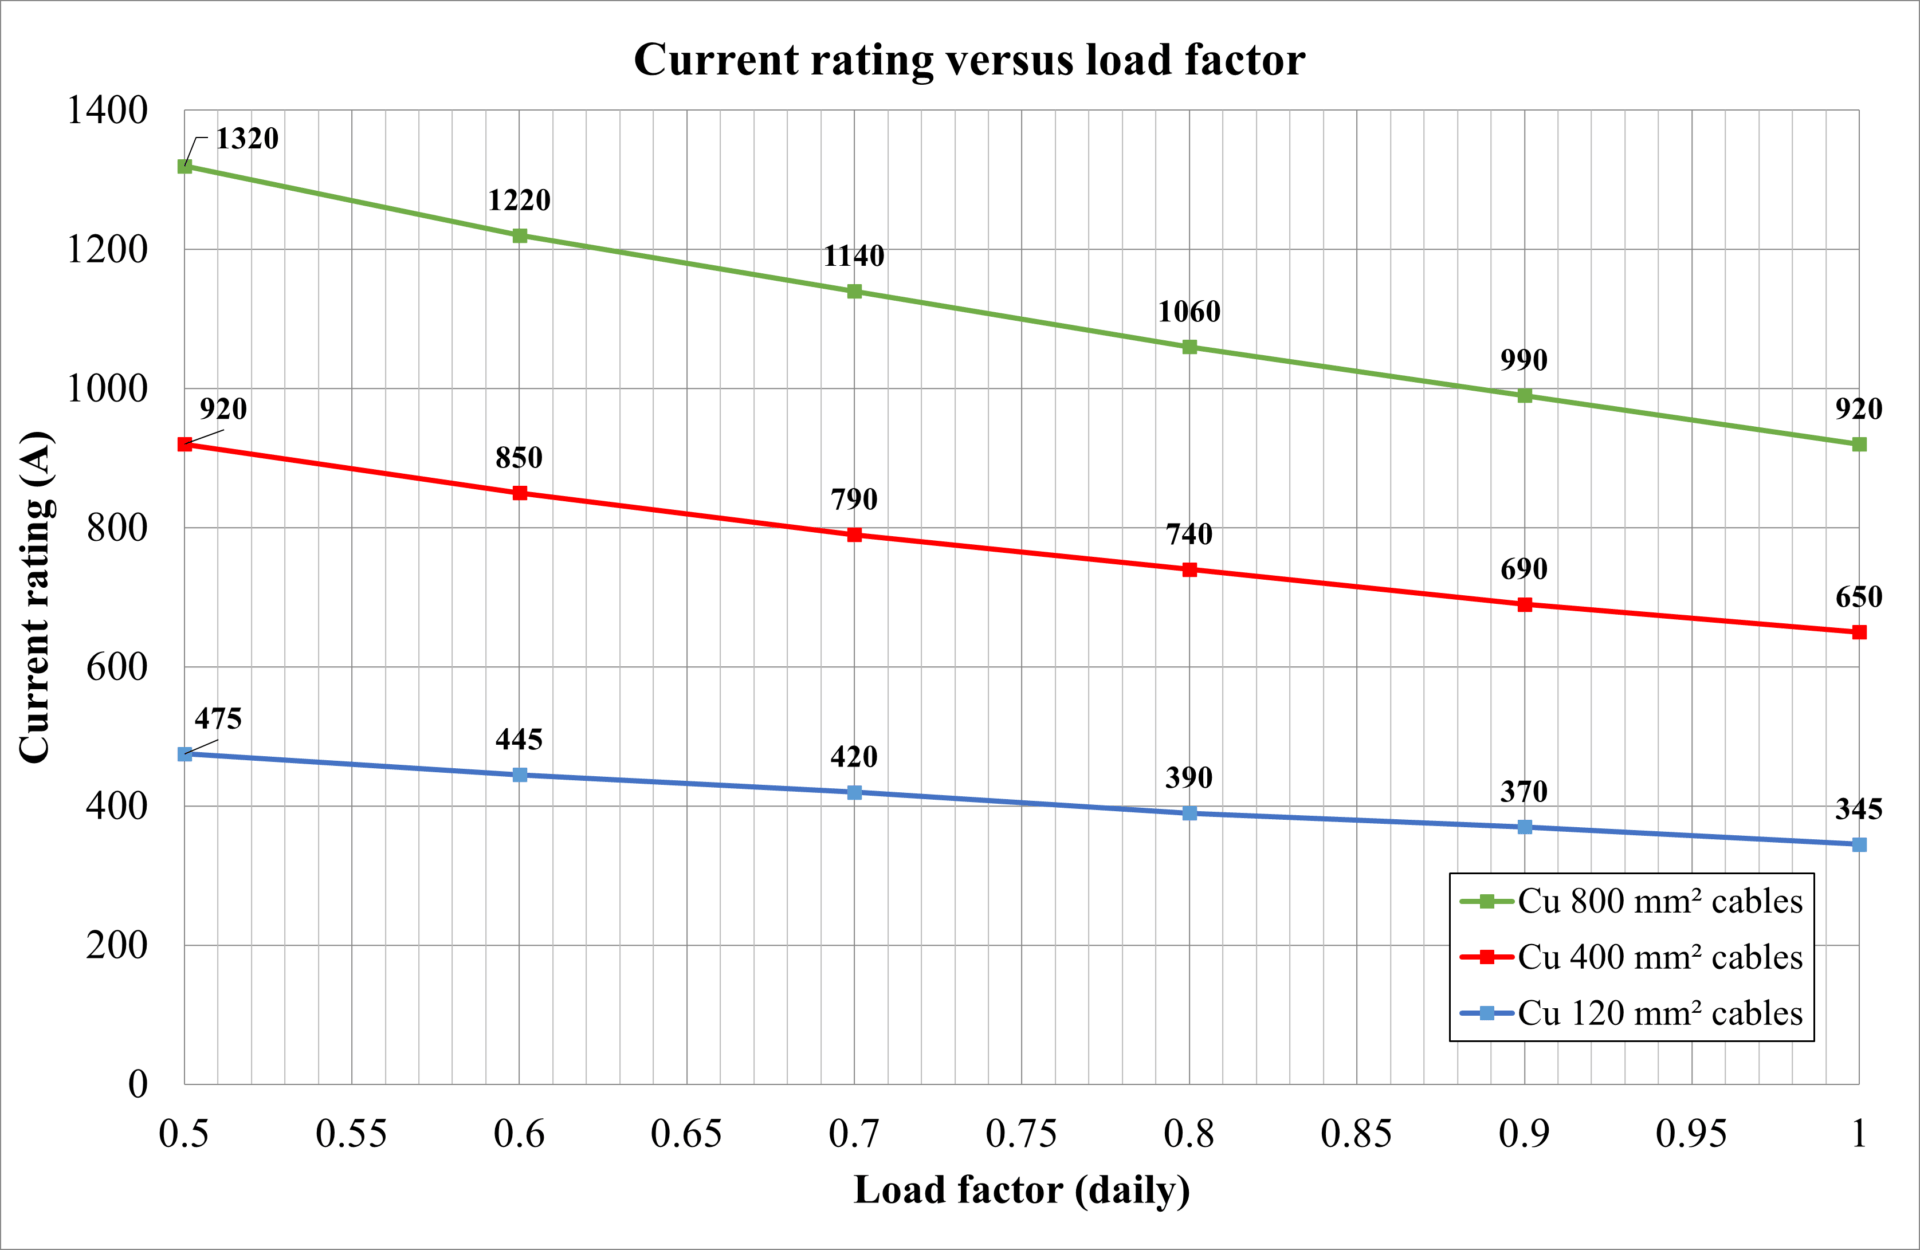
Load factor is the total energy transferred over a defined period, as a per unit (or percentage) value of energy that would have been transferred should the load have remained at its peak for the entire period. Typically, continuous loading (load factor of 1), called ‘steady state or continuous’ loading, is assumed during the design, often leading to conservative cable current ratings. The actual load factor should be used in cable current rating calculations but must be accurately determined or assessed. The load factor generally only applies to the buried sections of a cable installation.
The load factor has been varied from 0.5 up to 1 (steady-state), and the current rating was calculated (refer to Figure 20). As the load factor decreases from unity, the rated current of the cable increases. The increased current carrying capacity is due to the reduction in the external thermal resistance of the cables.
Duct fill material
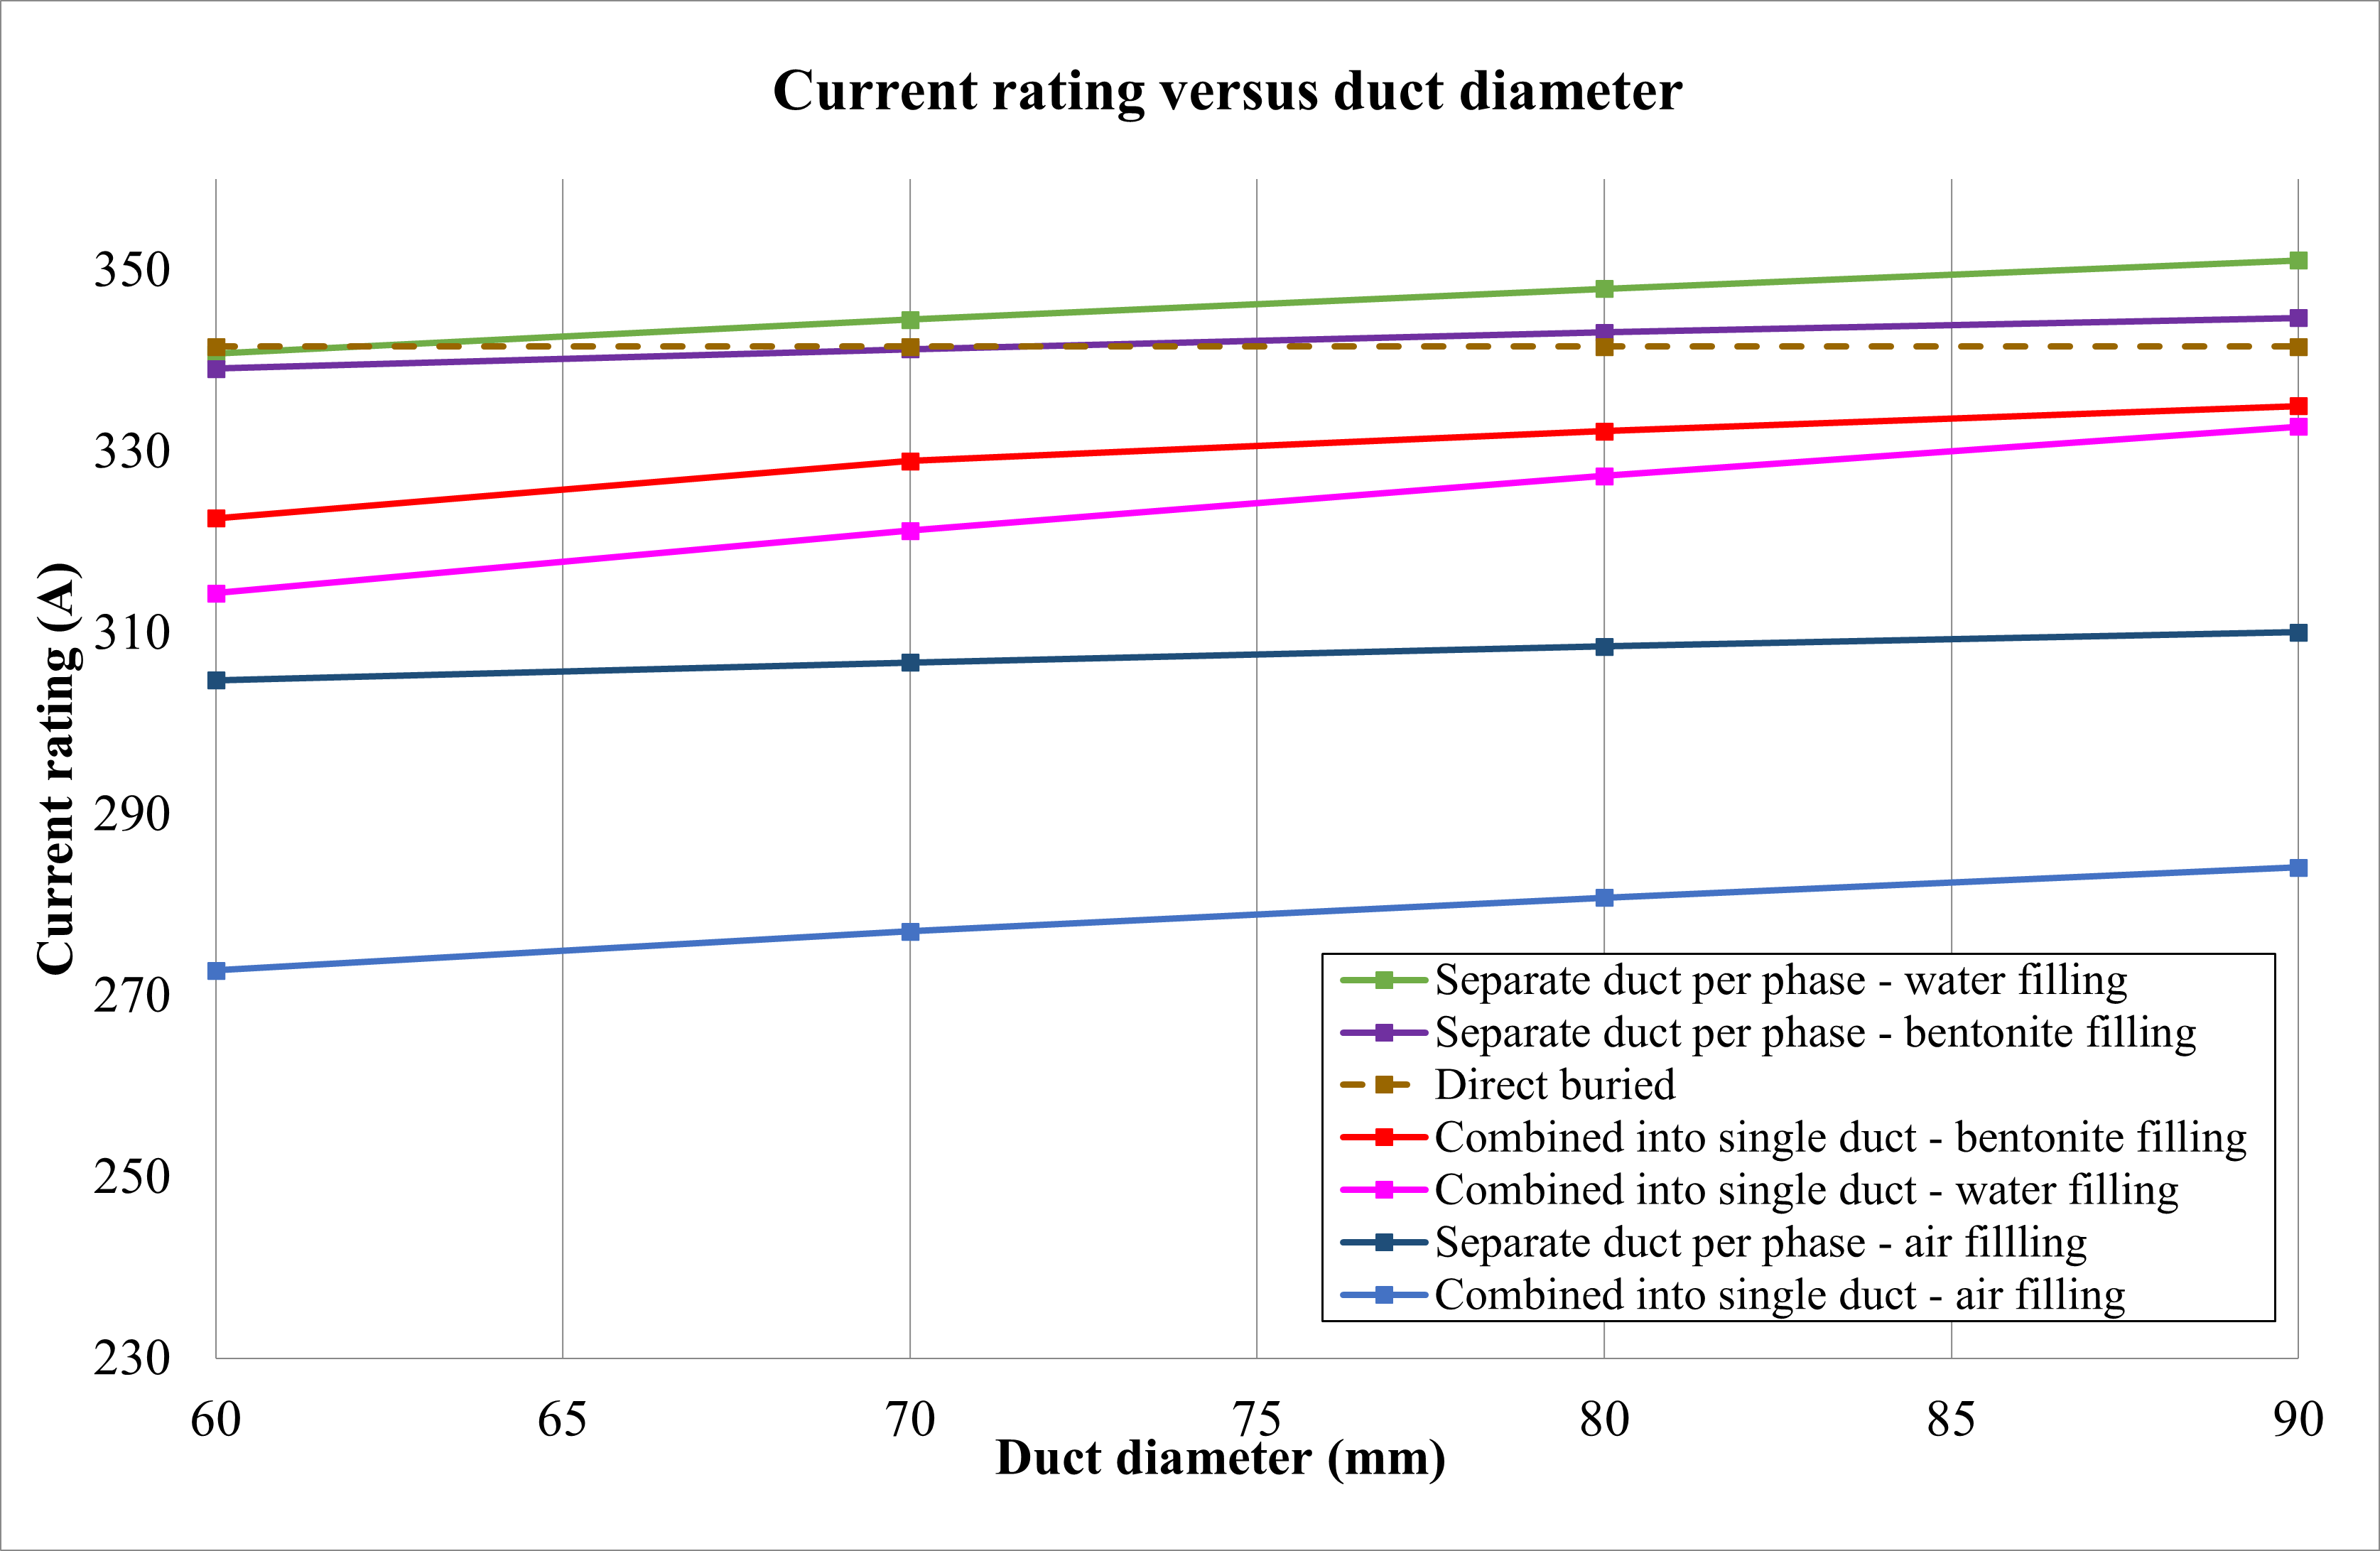
The effects on the current rating of cables inside ducts with different duct filling materials were studied, and the results are displayed in Figure 21. Here are some key observations:
- The use of different duct arrangements and filling materials affects the current rating.
- Combining cables in a single duct reduces the thermal resistance to the external surroundings, resulting in improved current-carrying capacity.
- Cables in air-filled ducts have the lowest current rating since air has a relatively high thermal resistivity.
- Cables in ducts filled with bentonite or water have a greater current rating than cables in air-filled ducts.
- Larger duct diameters filled with water or bentonite can exceed the current-carrying capacity of directly buried cables.
Bonding arrangement
We have already seen that solidly bonded cables have a lower current rating than single-point bonded cables. For high-voltage cable circuits carrying more than 500 A, sheath bonding arrangements such as single-point or cross-bonding of sheaths are implemented to eliminate circulating current losses. While the bonding arrangements incur additional equipment and maintenance costs, they often result in considerably smaller cable sizes for supplying the same load currents. Refer to our technical article about different bonding arrangements.
The metal sheath bonding arrangement selected for high-voltage cable systems has the second highest impact on cable current ratings, second only to the external thermal resistance (the installed environment) to the cables. This section examines the effects on the cable current rating caused by varying parameters related to the common cable sheath bonding arrangements.
Spacing between phases and sheath losses
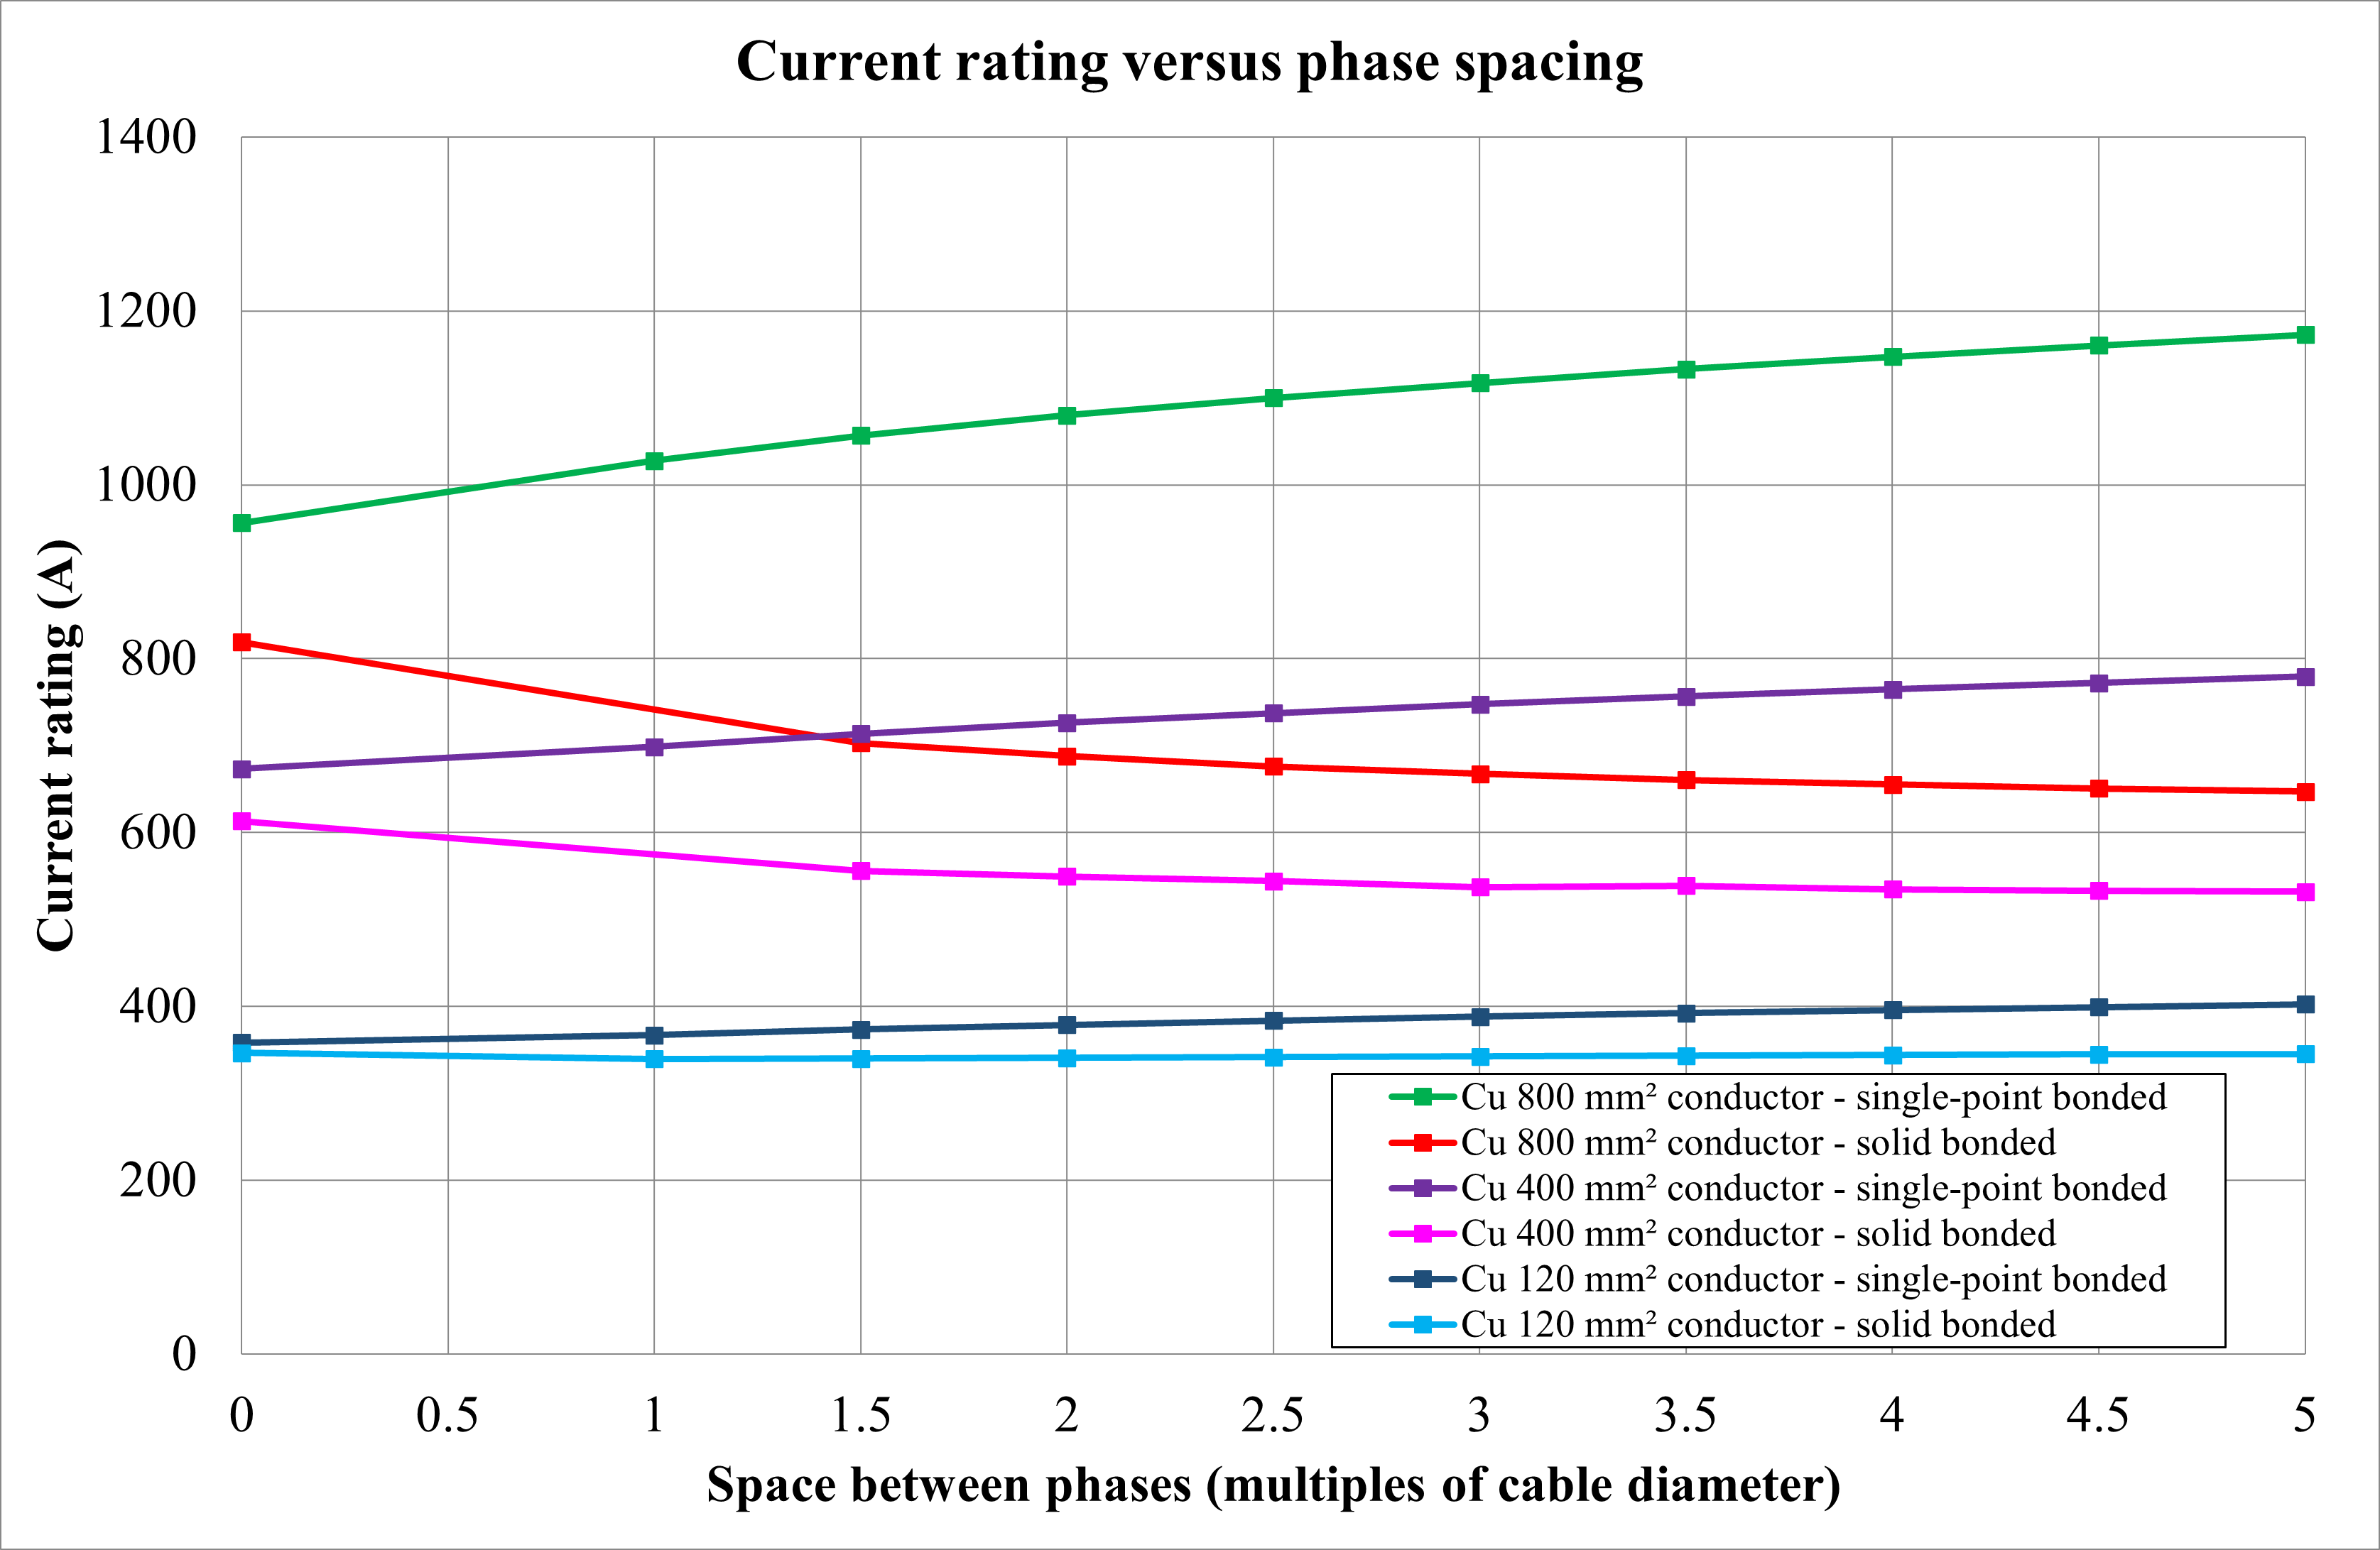
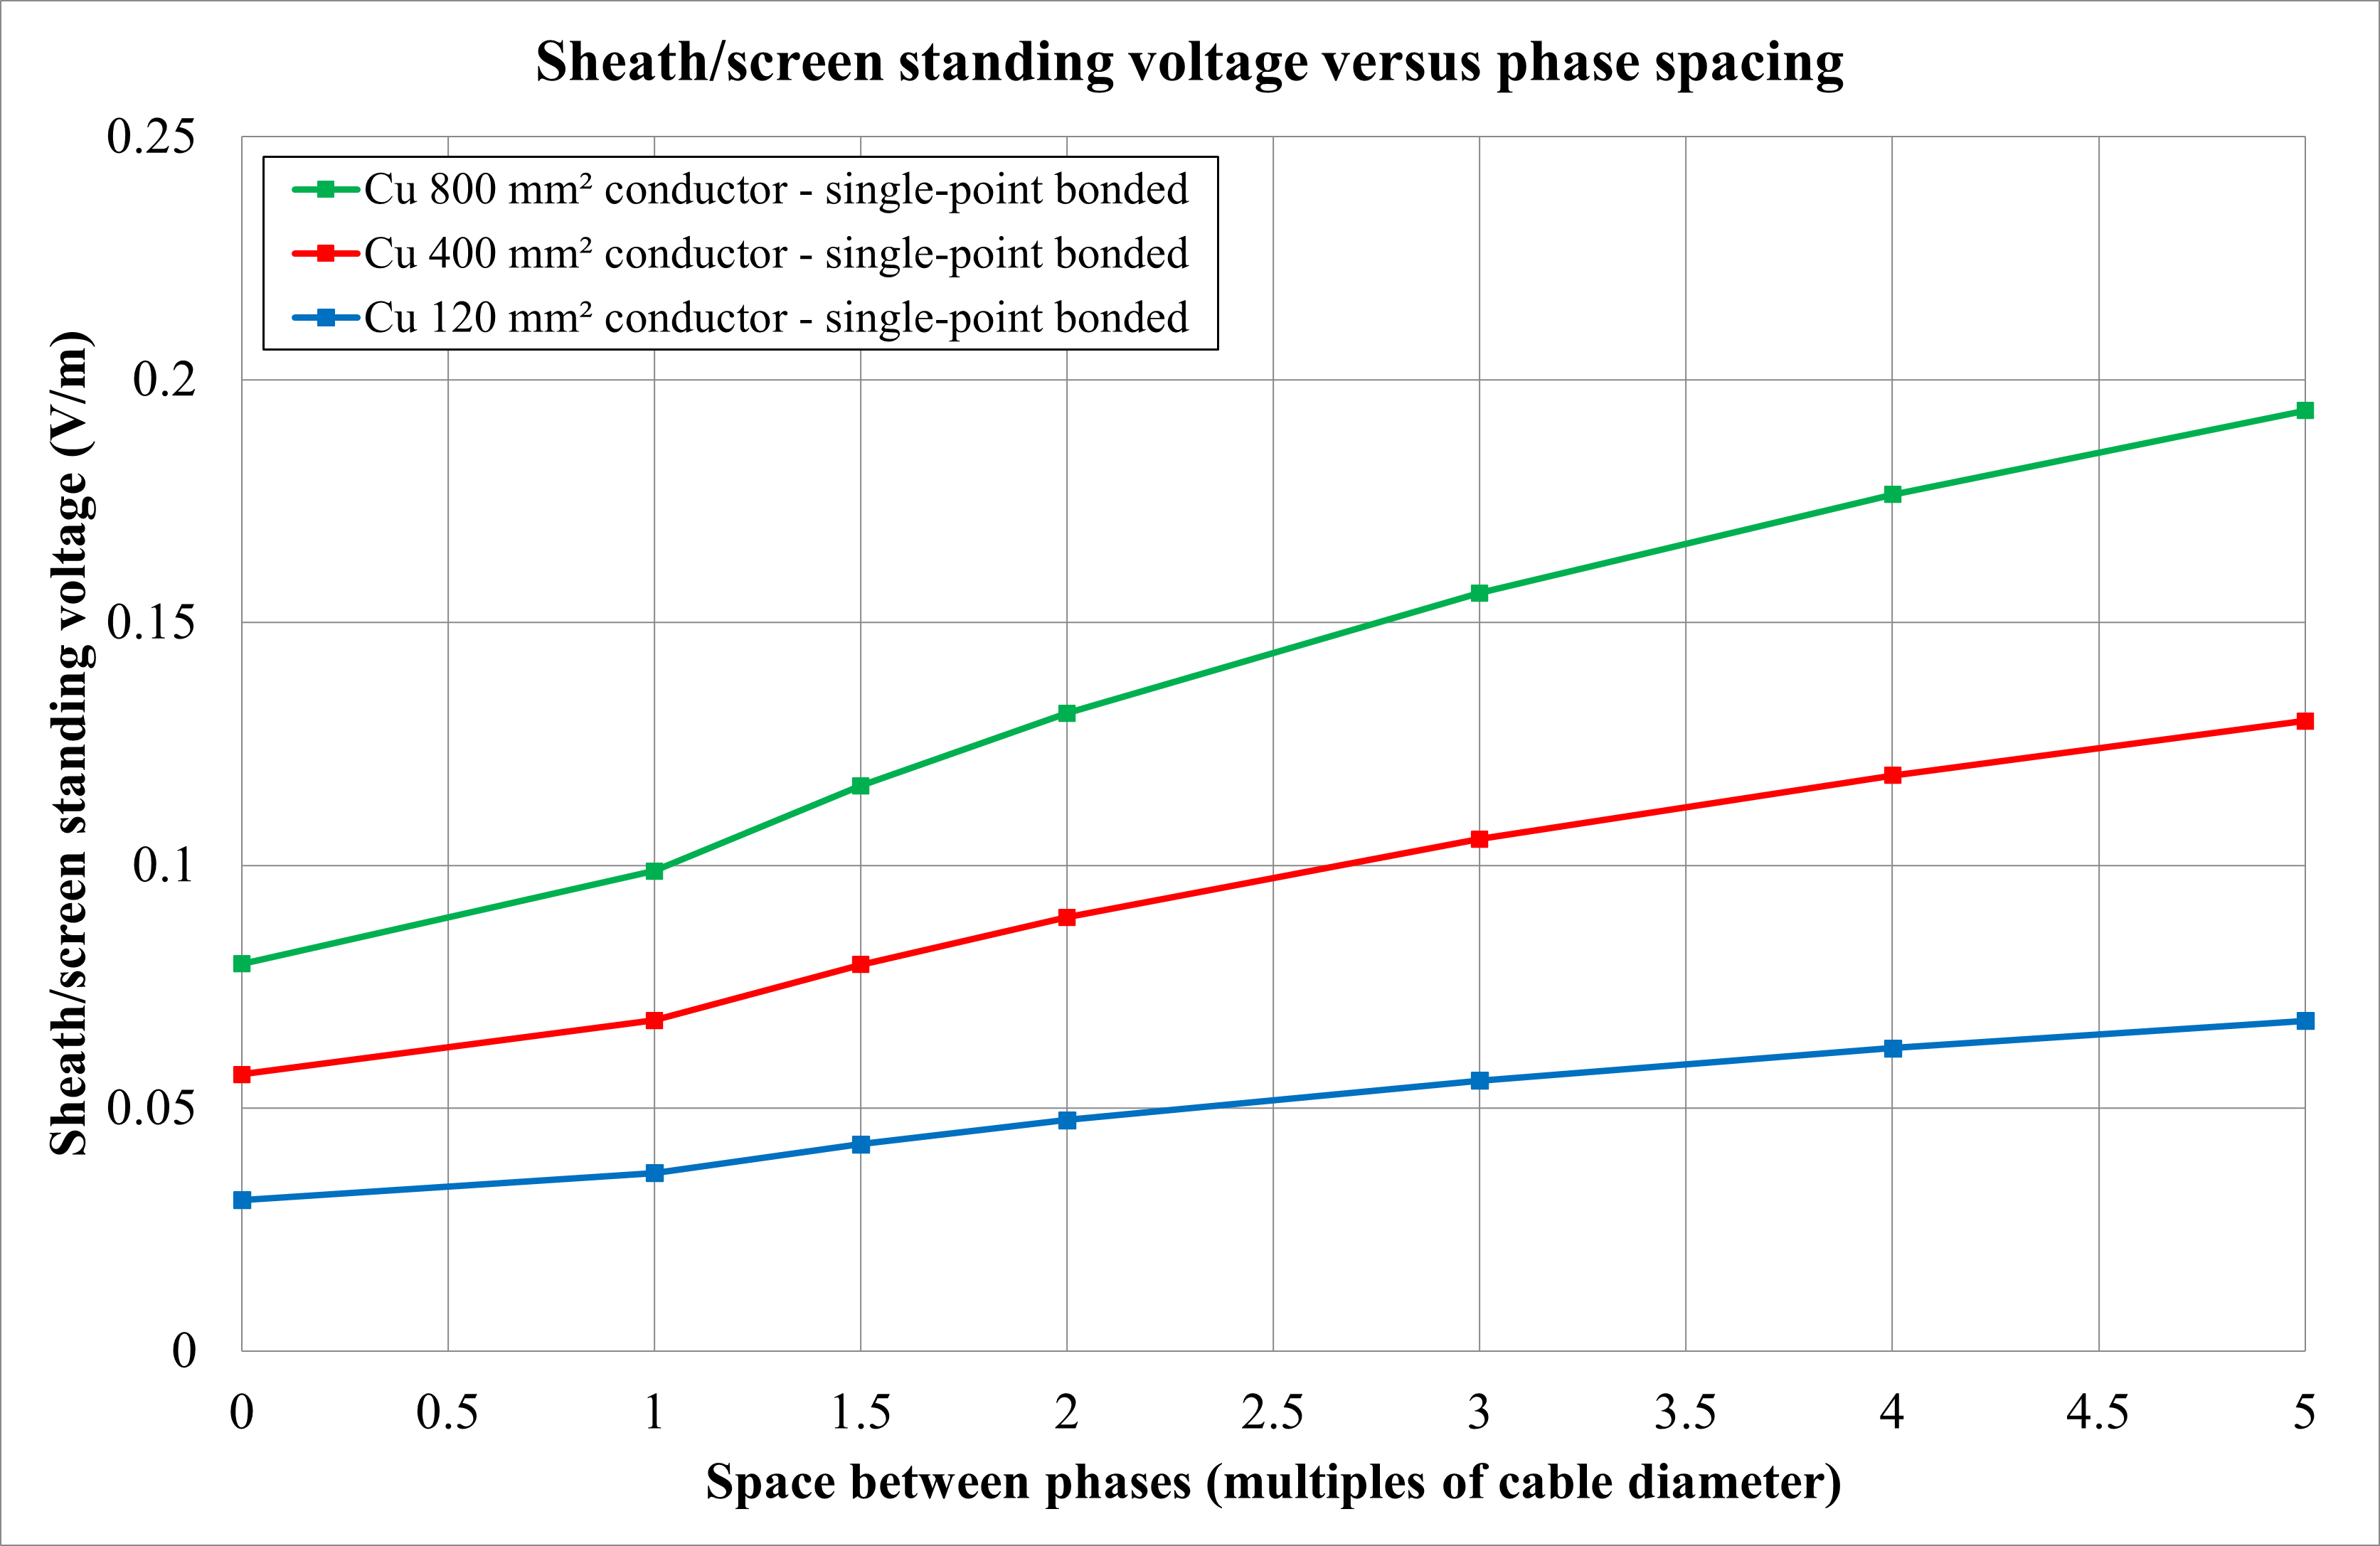
Figure 22 shows that as the spacing between phases increases, the current rating increases, except for large cables with solid bonding (explained in the next sections). This is due to a reduction in the mutual heating effects between phases. Increasing the phase spacing has the following positive and negative effects: Single-point bonded cables – current rating increases, often significantly; and sheath standing voltage increases due to increased mutual inductances between sheath and conductor (Figure 23); Solid bonded cables – losses in the sheath (or screen) increase with conductor spacing as the reactance of the sheath Xs increases according to the following relation:
Where s is phase spacing, and d is screen diameter. For large cables with solid bonding, the current rating reduces with phase spacing as the increase in sheath loss factor has a greater impact on the current rating than the reduction in mutual heating effects. For smaller cables with lower sheath loss factors, an increase in phase spacing causes a slight increase in the current rating.
Sheath circulating current
A disadvantage of solidly bonded cables is the induction of circulating currents into the metallic sheaths, which can reach up to 80% of the conductor current. The circulating current in the sheath is calculated by dividing the sheath reactance by the sheath impedance and multiplying it by the conductor current.
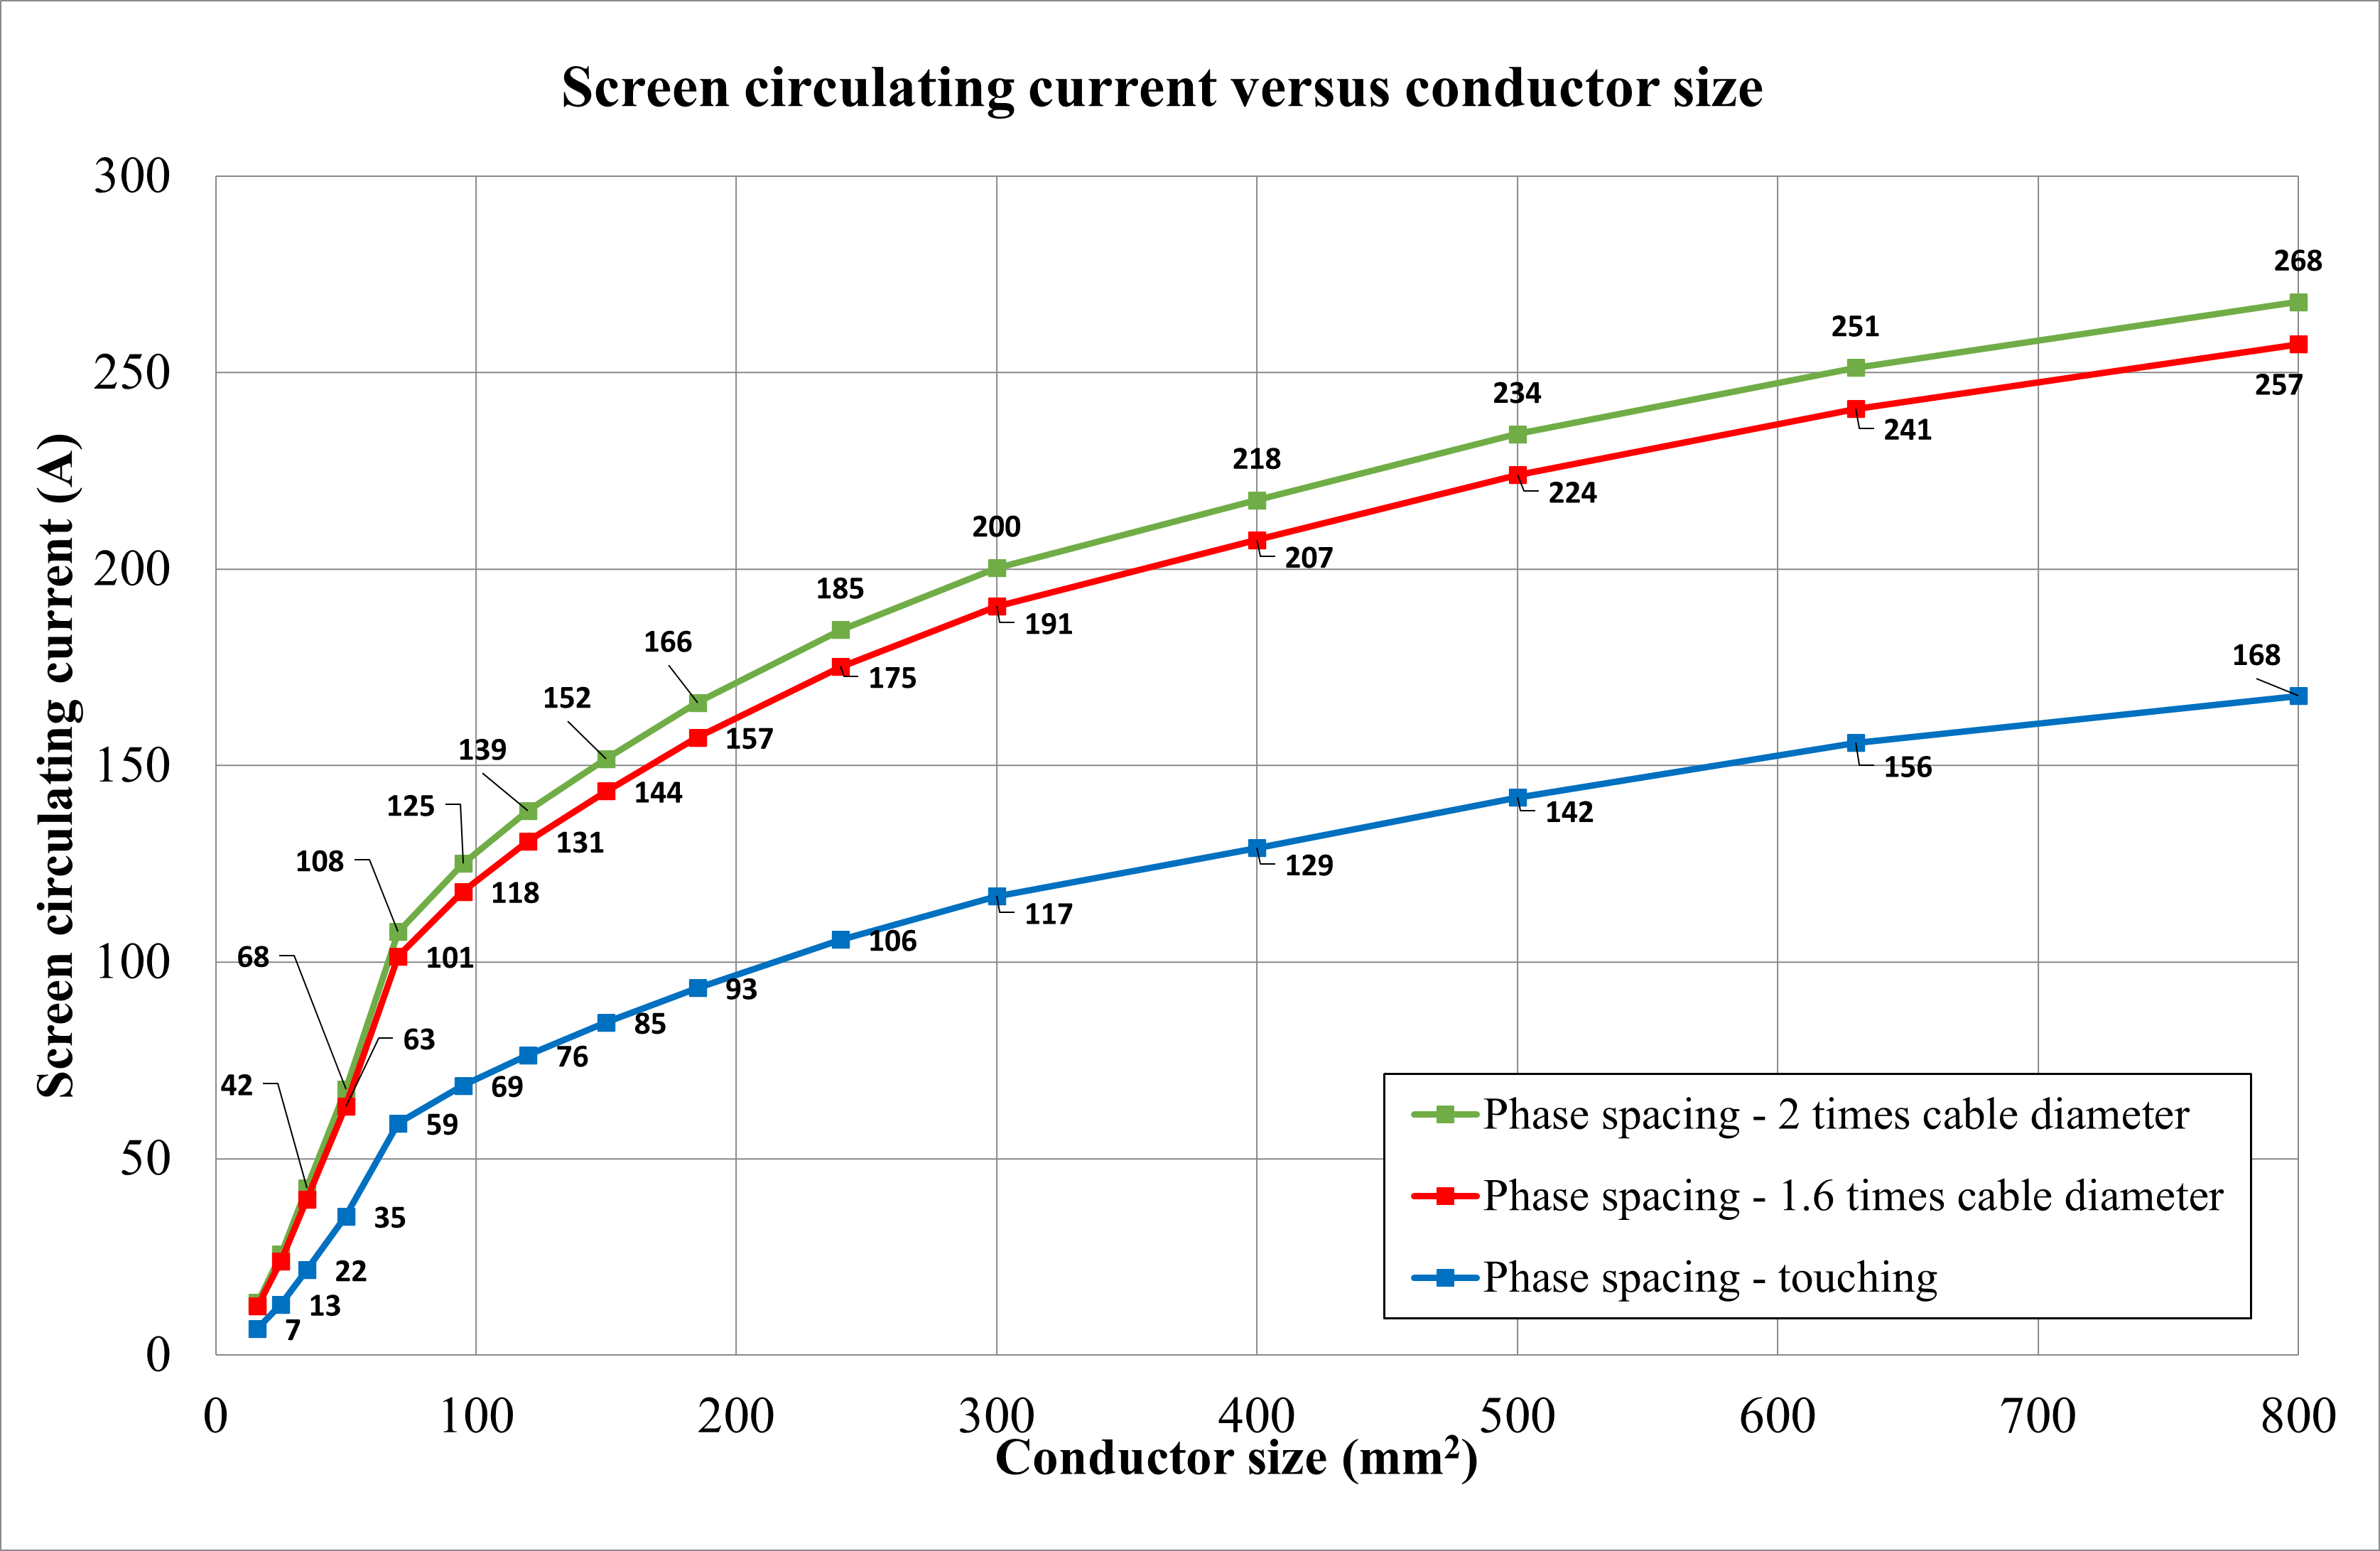
The conductor size has been varied from 16 mm2 up to 800 mm2, and the current rating was plotted for different phase spacings. Below is a list of the observations from Figure 24.
The circulating current in the screen or sheath is directly proportional to the conductor’s size as the cable’s current carrying capacity increases.
The sheath reactance is directly proportional to the phase spacing. Therefore, as the phase spacing increases, the sheath reactance increases, resulting in higher screen circulating currents.
Varying phase spacing along the route for solidly bonded cables
The phase spacing between single-core cables may differ along a cable run. For solidly bonded cables, an increase in phase spacing increases the sheath reactance (Xs), which decreases the current rating.
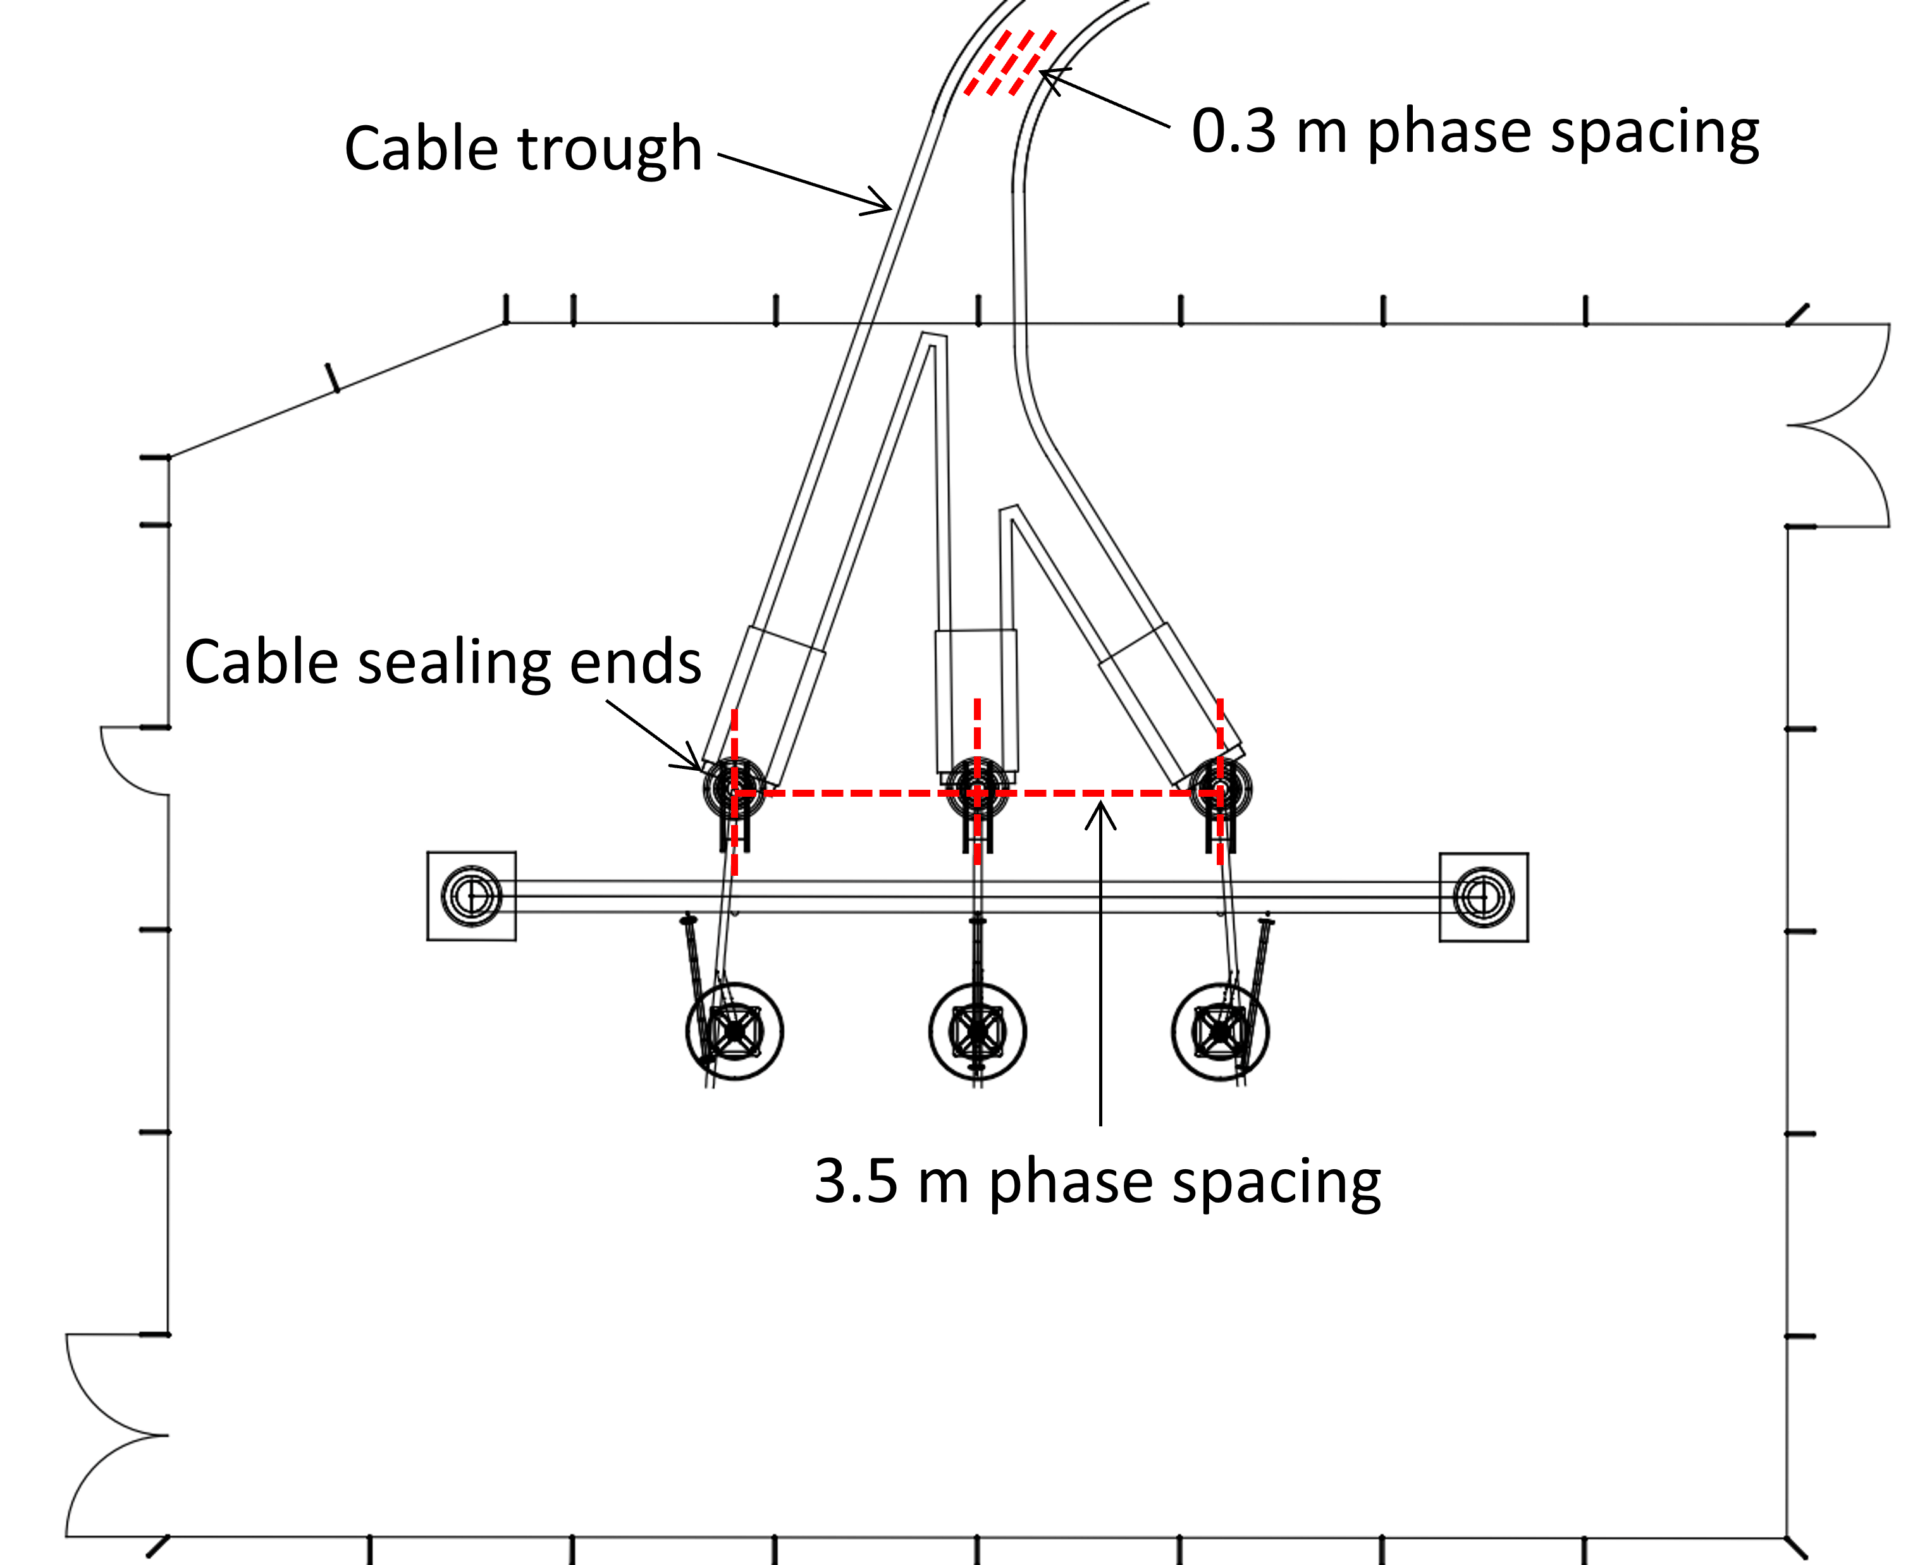
A practical example of single-core cables installed inside a trough in a substation is depicted in Figure 25, where the phase spacing varies from 0.3 m up to 3.5 m.
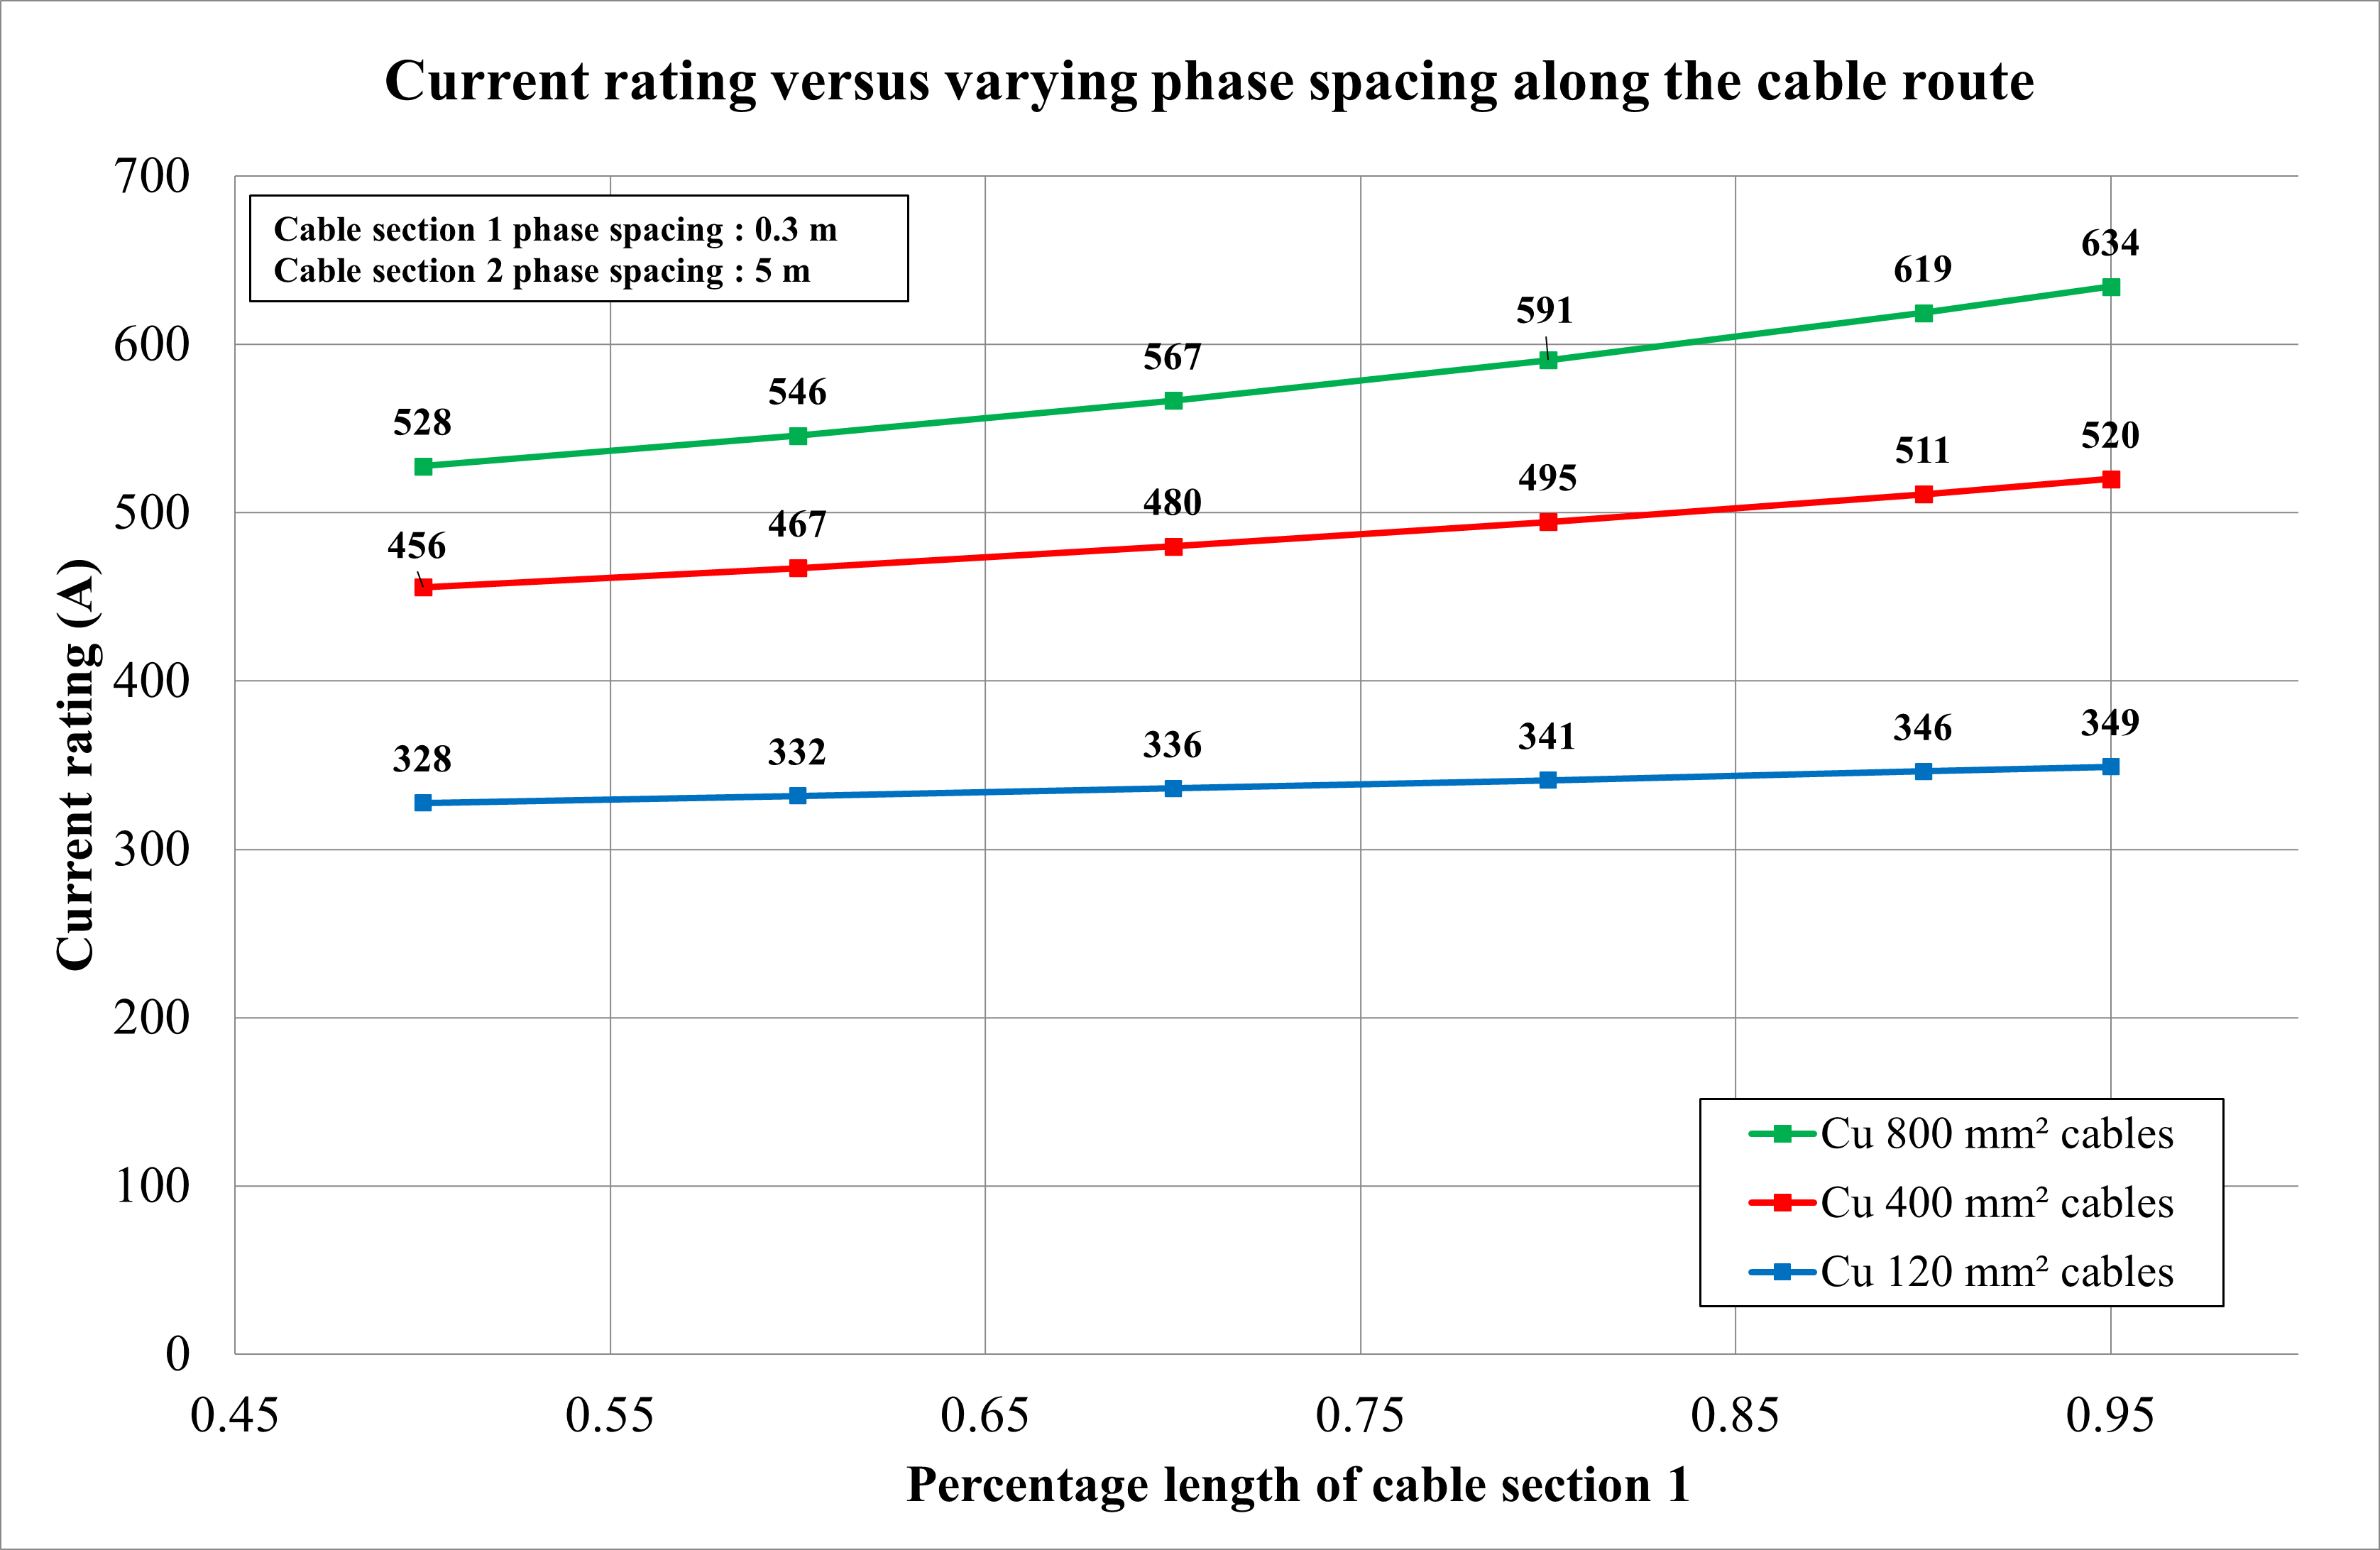
To understand the impact of varying phase spacing on solidly bonded cables, consider a run of 1000 m consisting of two sections with different phase spacing (average) between the sections. The first section has a phase spacing of 0.3 m, while the second has a phase spacing of 5 m. Figure 26 shows as the relative length of cable section 1 increases, the current rating also increases.
Varying minor section length for cross-bonding
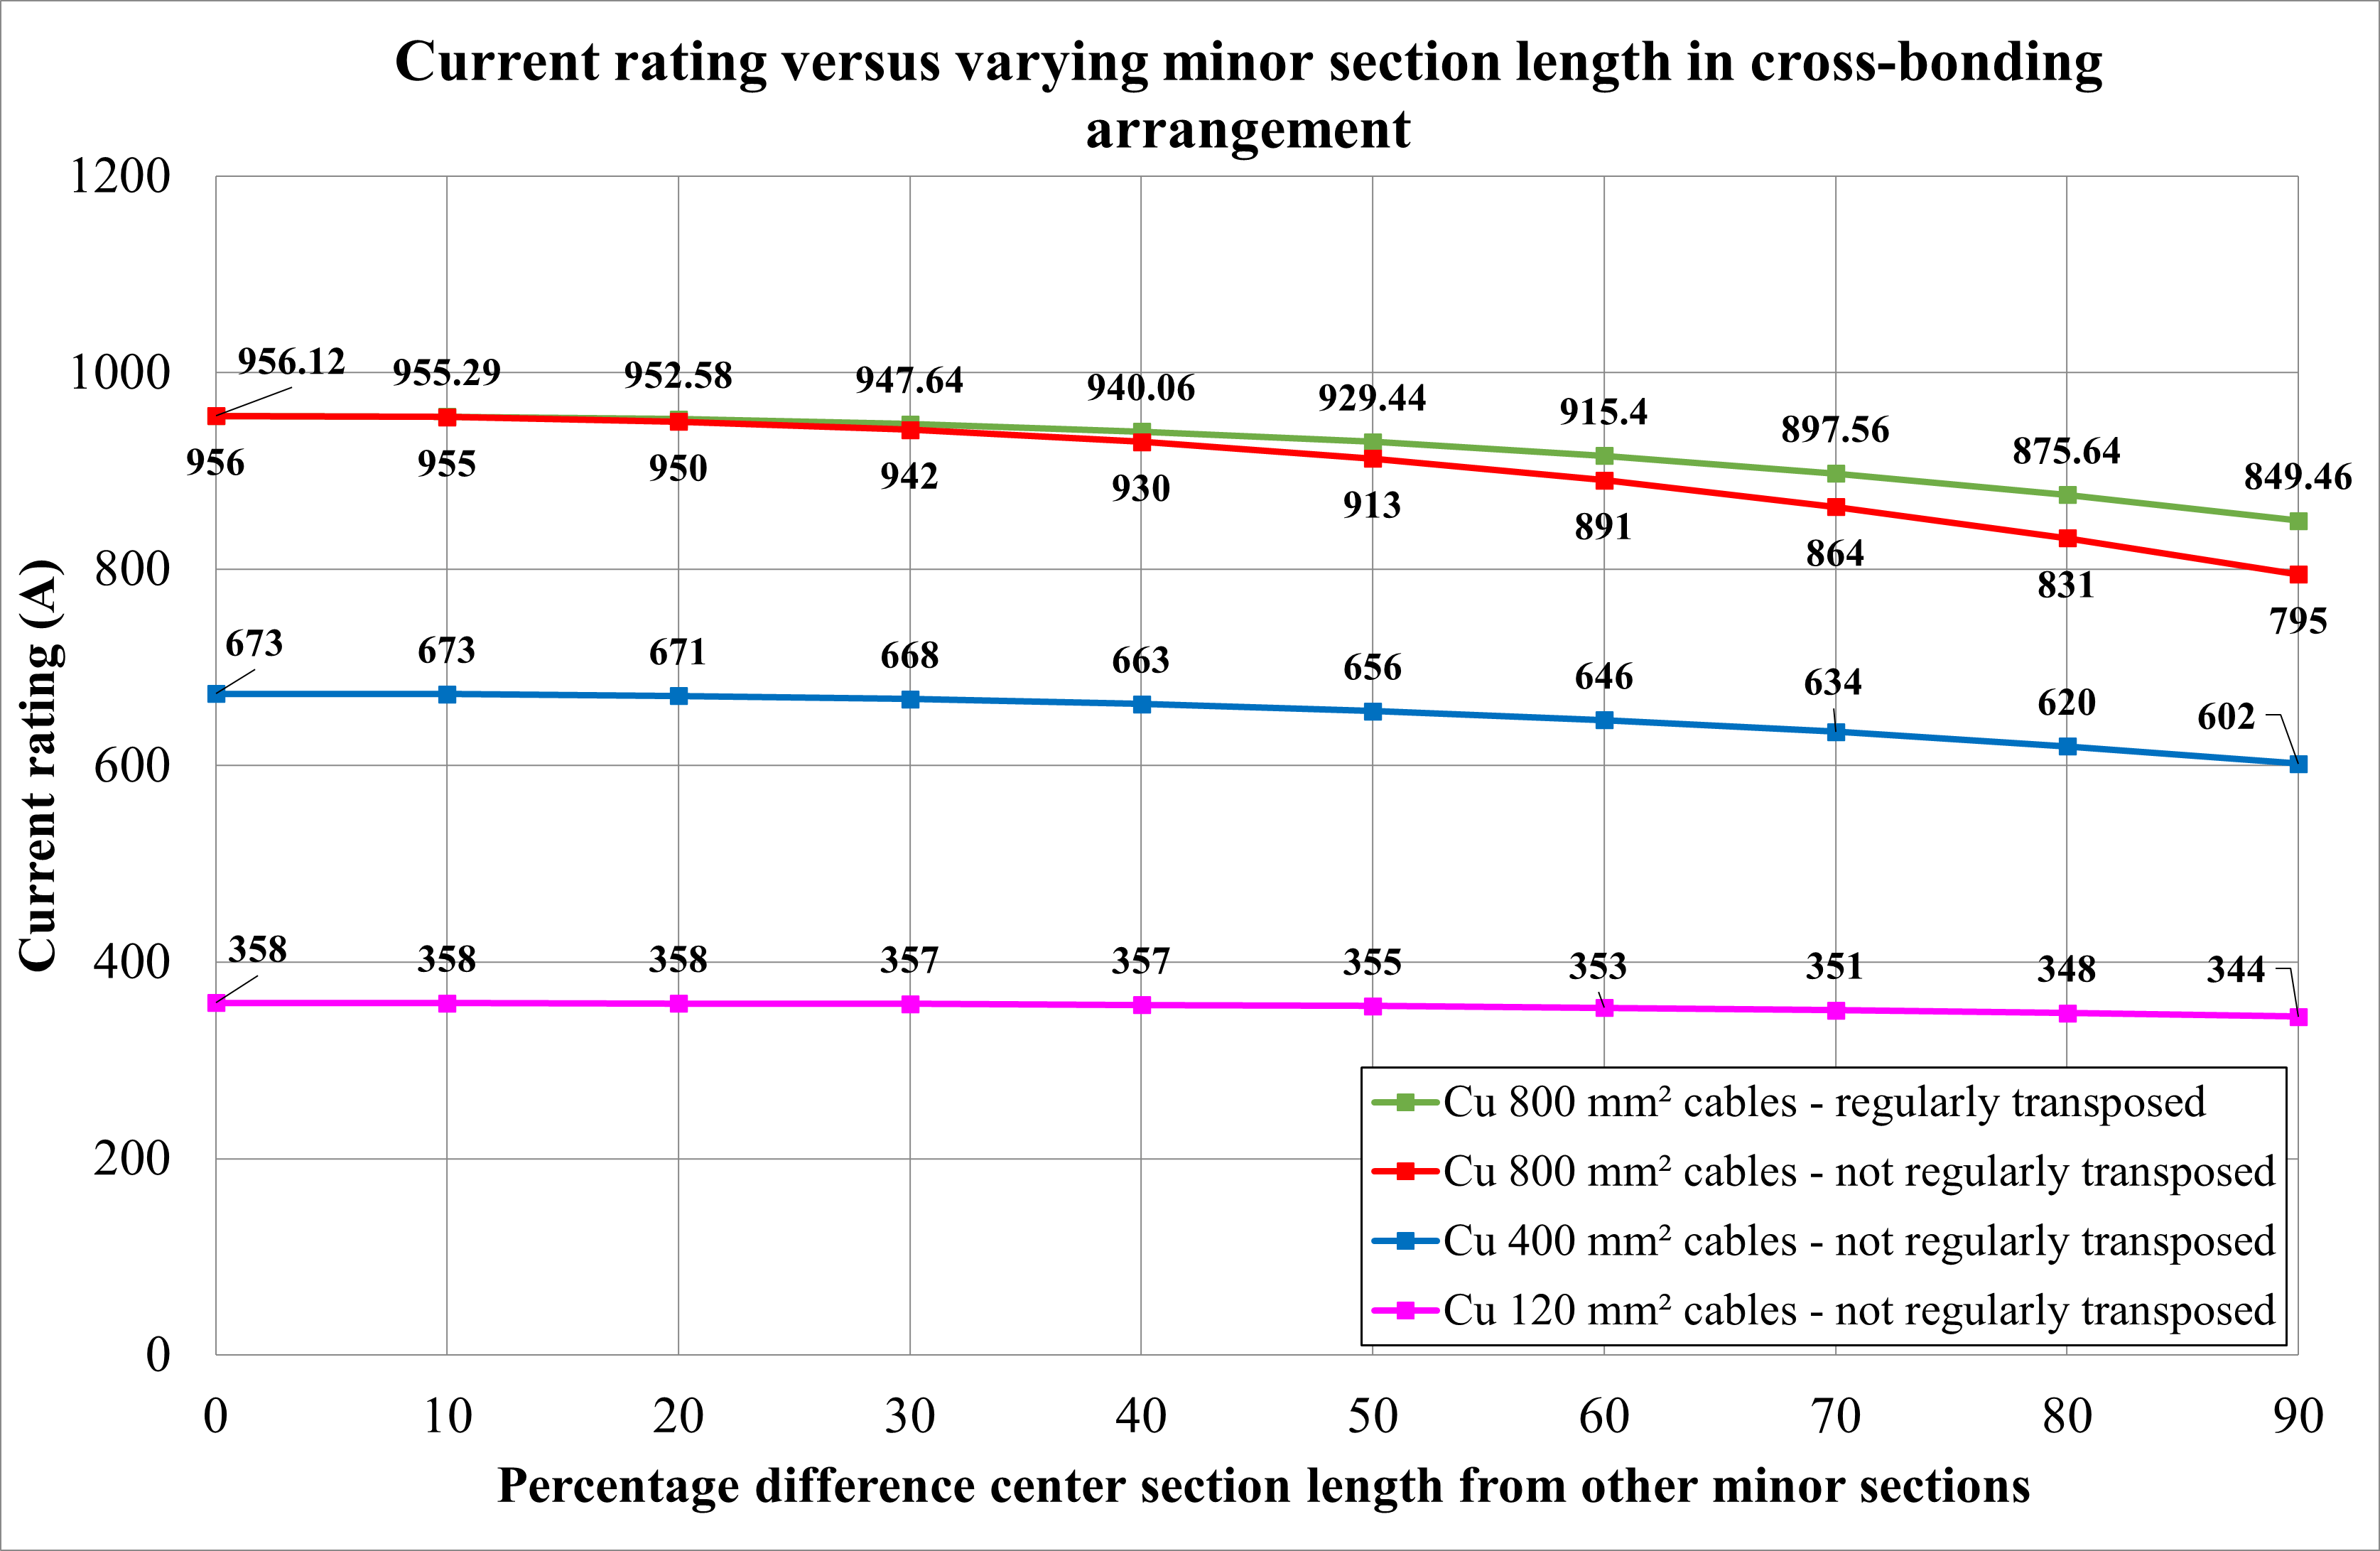
In single-core cable systems with cross-bonded sheaths, the sheaths are divided into minor sections and cross-connected to neutralize the voltage in three successive minor sections. A challenge with cross-bonding is ensuring equal lengths for minor sections. Consider a cross-bonded cable system with non-transposed phase conductors that is 1500 m in length, where each minor section is 500 m. Figure 27 illustrates the effect on the current rating when one of the minor sections varies in length compared to the others, ranging from 500 meters (equal to the other minor sections), down to 50 meters.
Below is a list of the observations from Figure 27.
- The circulating current in the sheath increases, and the current rating decreases as the length of the single minor section reduces (compared to the other minor section lengths).
- Larger cables are affected more by cross-bonded systems with unequal minor section lengths.
- When the phase conductors are regularly transposed, higher current ratings are achieved primarily due to reduced mutual reactances between the cables.
Conclusions
Accurate cable ratings and performance determination are important for providing an economical, functional, and safe design. Access to powerful software tools, providing powerful insights, is imperative.
Cables in air
The conductor size and material significantly affect the current rating. Ambient air temperature affects the current rating. The current rating of cables in the air enclosed in ducts depends on the duct size and, to a lesser extent, on the duct material. Current ratings of cables in the air are affected by their proximity to other groups of cables or if they are exposed to direct solar radiation.
Buried cables
The thermal resistivity and ambient temperature of the soil both have a major effect on the current rating. To a lesser degree, spacing between phases of buried single-core cables affects the current rating; for single-point bonded cables, phase spacing affects the sheath standing voltage, which is an important safety-related consideration for designers. An interesting phenomenon for solidly bonded cables is that although the mutual heating between cables is reduced for increased phase spacing, the sheath circulating current will increase, which may lead to an overall lower current rating. Sheath loss factor affects current rating, and sheath loss factor in multi-core cables is much lower than in single-core cables. Backfill thermal resistivity and area also affect the current rating. Mutual heating between cables installed in grouped buried circuit arrangements reduces their current rating; however, this should be assessed using proper and accurate modelling techniques (the finite element method is the most accurate for modelling mutual heating effects).
Bonding arrangement
The bonding arrangement of cable sheaths significantly affects the current rating of high-voltage cable systems. Solidly bonded cables have a lower current rating compared to single-point bonded cables. Additional bonding arrangements, such as cross-bonding, are implemented to eliminate circulating current losses, resulting in smaller cable sizes for the same load currents. The spacing between phases affects the current rating, with an increase in spacing leading to increased current ratings for single-point bonded cables. However, for solidly bonded cables, an increase in phase spacing results in increased sheath losses, ultimately reducing the current rating, especially for larger cables. The induction of circulating currents in sheaths is a disadvantage of solid-bonded conductors, with the circulating current being directly proportional to the conductor size and sheath reactance. Furthermore, variations in phase spacing along the cable route and minor section lengths in cross-bonding systems affect the current rating, with smaller phase spacing and equal minor section lengths resulting in higher ratings.
References
[1] IEC 60287-1-1:2023 Electric Cables – Calculation of the current rating – Part 1-1: Current rating equations (100 % load factor) and calculation of losses – General. International Electrotechnical Commission.
[2] IEC 60287-2-1:2023 Electric cables – Calculation of the current rating – Part 2-1: Calculation of thermal resistance. International Electrotechnical Commission.
[3] IEC 60287-3-1:2017 Electric cables – Calculation of the current rating – Part 3-1: Operating conditions – Site reference conditions. International Electrotechnical Commission.
[4] Neher J., McGrath M. 1957. Calculation of the temperature rise and load capability of cable systems. AIEE Transactions Part III – Power Apparatus and Systems. 76:752–772.
[5] Olex. 2009. High voltage cable catalogue.
Appendix
Cable model
Cable dimensions are required for modelling in ELEK Cable HV Software™. The following cable data was taken from the Olex HV cable catalogue [ref. 5].
Cable data for the single core cable in Figure 28:
- Description: 6.35/11 kV Single Core Screened and PVC Sheathed.
- Conductor material: Stranded copper or Aluminium
Cable data for the three core cable in Figure 29:
- Description: 6.35/11 kV Cu Multi Core XLPE Insulated, Screened, PVC bedded and PVC Sheathed
- Conductor material: Stranded copper
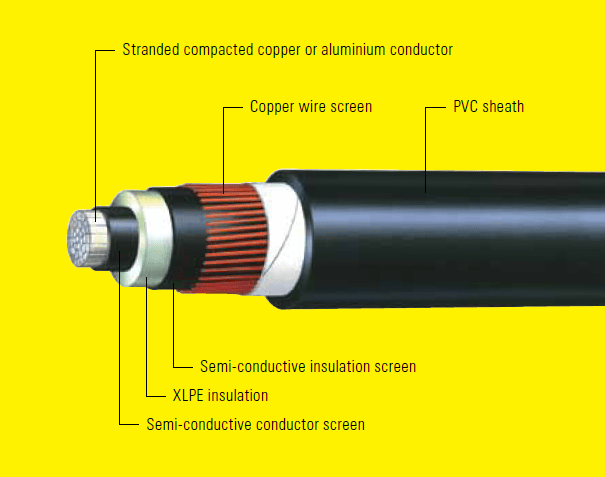
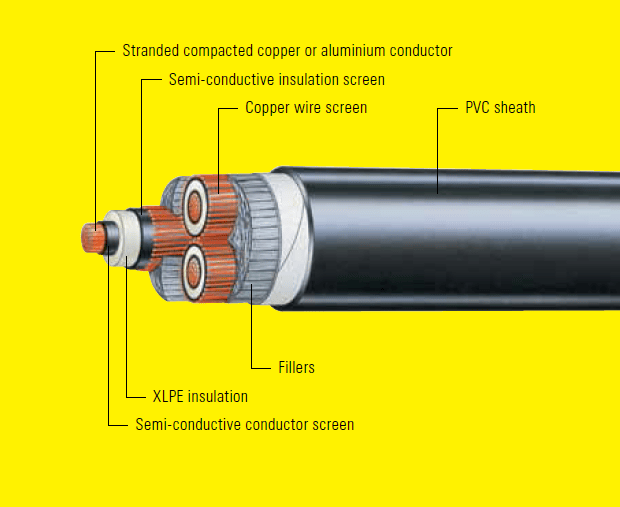
Table 1 Cable dimensions for modelling single core cables. All dimensions are in mm unless otherwise specified
| Cable Size (mm2) | 120 | 400 | 800 |
|---|---|---|---|
| Nominal conductor diameter | 13.1 | 23.6 | 35.9 |
| Conductor screen thickness | 0.55 | 0.7 | 0.9 |
| Insulation thickness | 3.4 | 3.4 | 3.4 |
| Semi-conductive insulation screen thickness | 0.8 | 0.9 | 0.9 |
| Copper screen wire thickness | 1.35 | 1.35 | 1.35 |
| PVC shealth thickness | 2.05 | 2.45 | 3 |
Table 2 Cable dimensions for modelling three core cables. All dimensions are in mm unless otherwise specified
| Cable Size (mm2) | 120 | 400 |
|---|---|---|
| Nominal conductor diameter | 3 x 13.1 | 3 x 23.6 |
| Conductor screen thickness | 3 x 0.55 | 3 x 0.7 |
| Insulation thickness | 3 x 3.4 | 3 x 3.4 |
| Semi-conductive insulation screen thickness | 3 x 0.8 | 3 x 0.9 |
| Copper screen wire thickness | 3 x 0.85 | 3 x 0.85 |
| PVC shealth thickness | 7.77 | 9.72 |
| PVC shealth diameter | 67.9 | 95.5 |


