Click through the steps in the window below. Turn on your speakers to hear the voiceover.
Overview of the problem
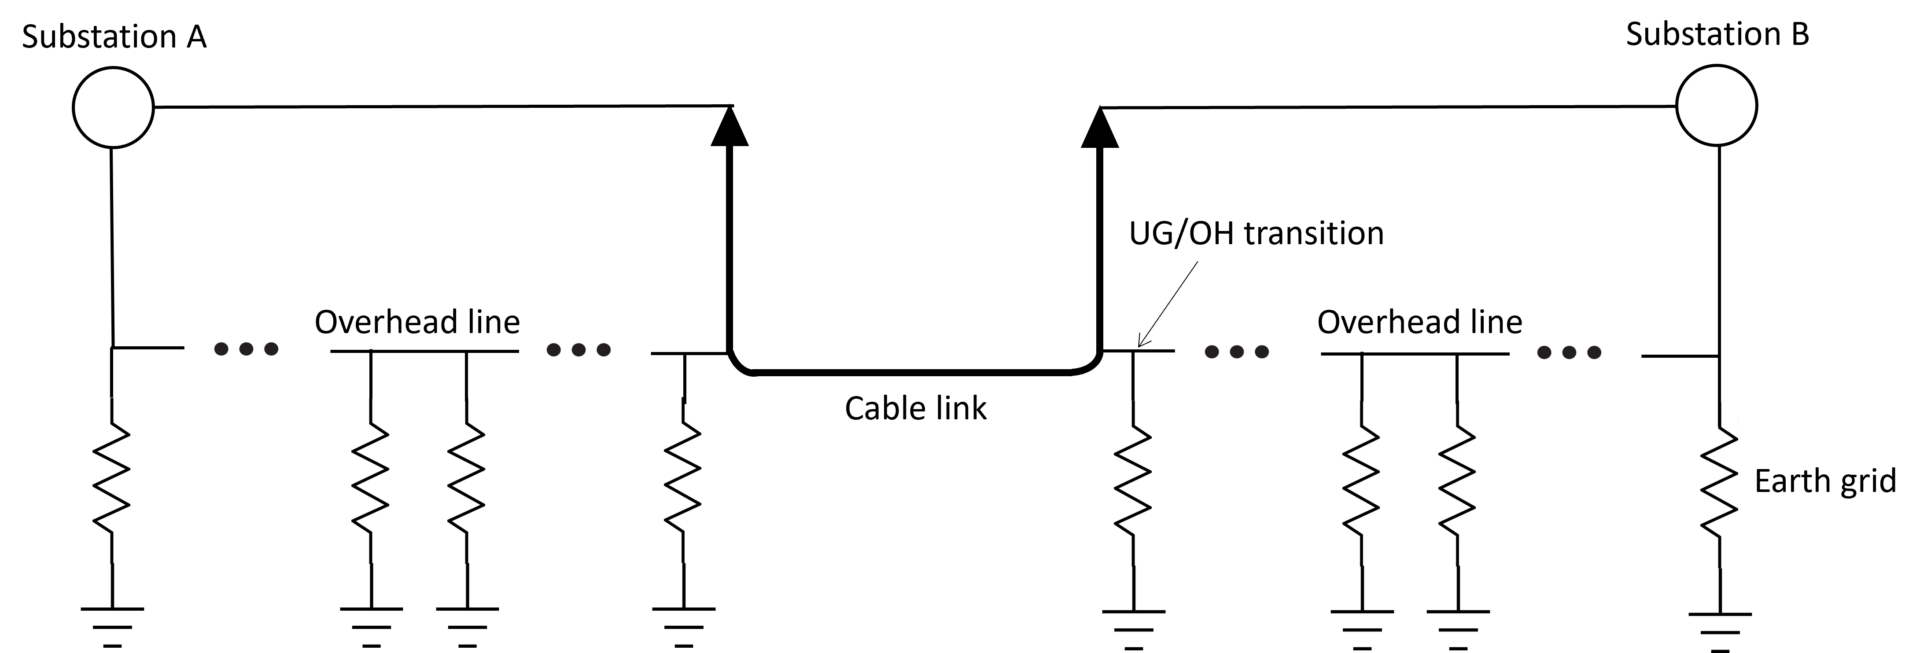
The high-voltage transmission lines connected between substations are predominantly constructed with overhead powerlines. In urban areas, it is common for an underground cable link to be installed in the middle of an overhead transmission line (referred to as a siphon system).
The transition between underground cables and overhead lines (UG/OH) occurs at either transition poles for medium voltage (MV) or above-ground ancillary facilities such as cable-sealing end compounds or cable-sealing end platforms typically with metallic security fences for high-voltage (HV) transmission lines.
Excessive EPR is likely to occur at a UG/OH transition of a siphon transmission system. The highest EPR at the UGOH transition will most likely occur for a fault at the substation, not necessarily a fault at the transition itself. Refer to our technical article Fault Current Distribution for Cable Transmission Lines.
In this tutorial, we use ELEK SafeGrid Earthing Software to model the earth fault current distribution for two substations connected by a siphon transmission system.
System parameters
A table with the exact system parameters used for the modelling is in the Appendix.
How to model
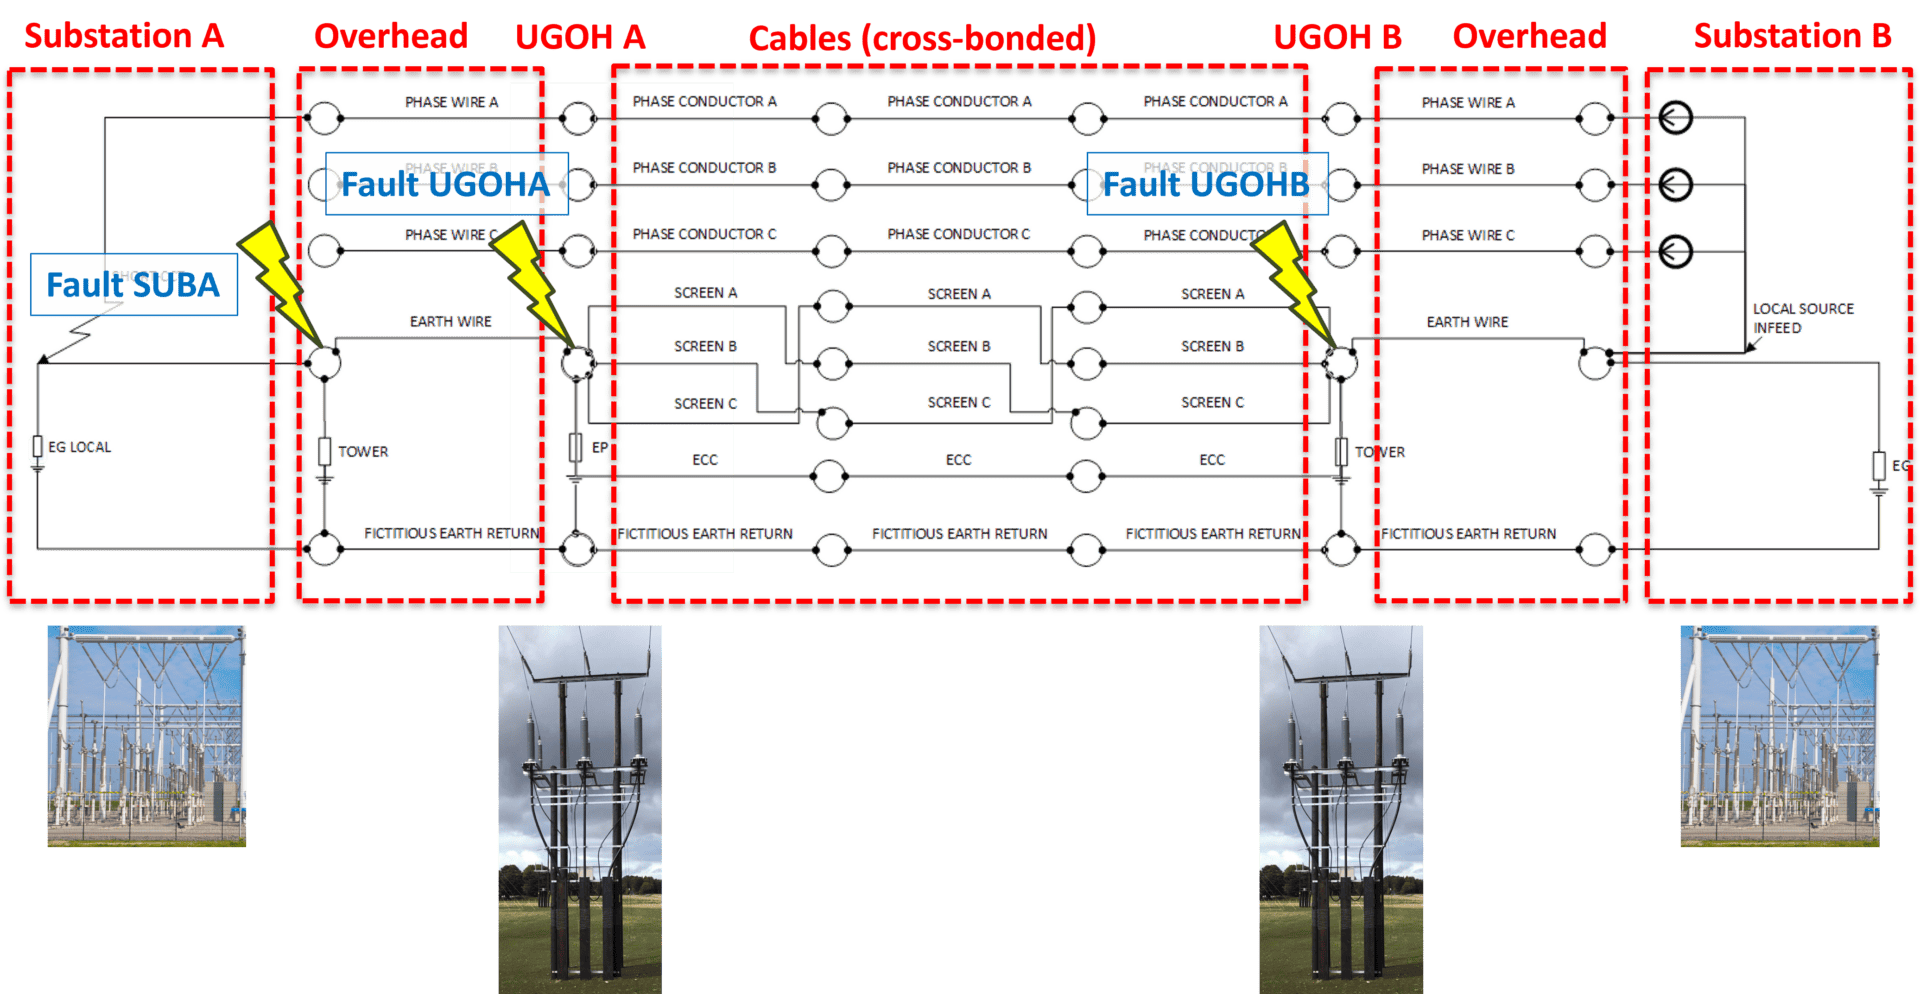
Three single-phase-to-earth fault scenarios are modelled. The first fault scenario is at Substation A, whilst the second and the third fault scenarios are at the underground and overhead (UG/OH) transition stations. The fault current distribution and earth potential rise (EPR) are obtained at critical locations for comparison.
Results examined
The earth fault currents and earth potential rise (EPR) for the main earthing points was recorded (refer to the table in the Appendix).
The naming of the node points used by default in the software needs to be translated to the earthing point locations
based on the equivalent circuit diagram.
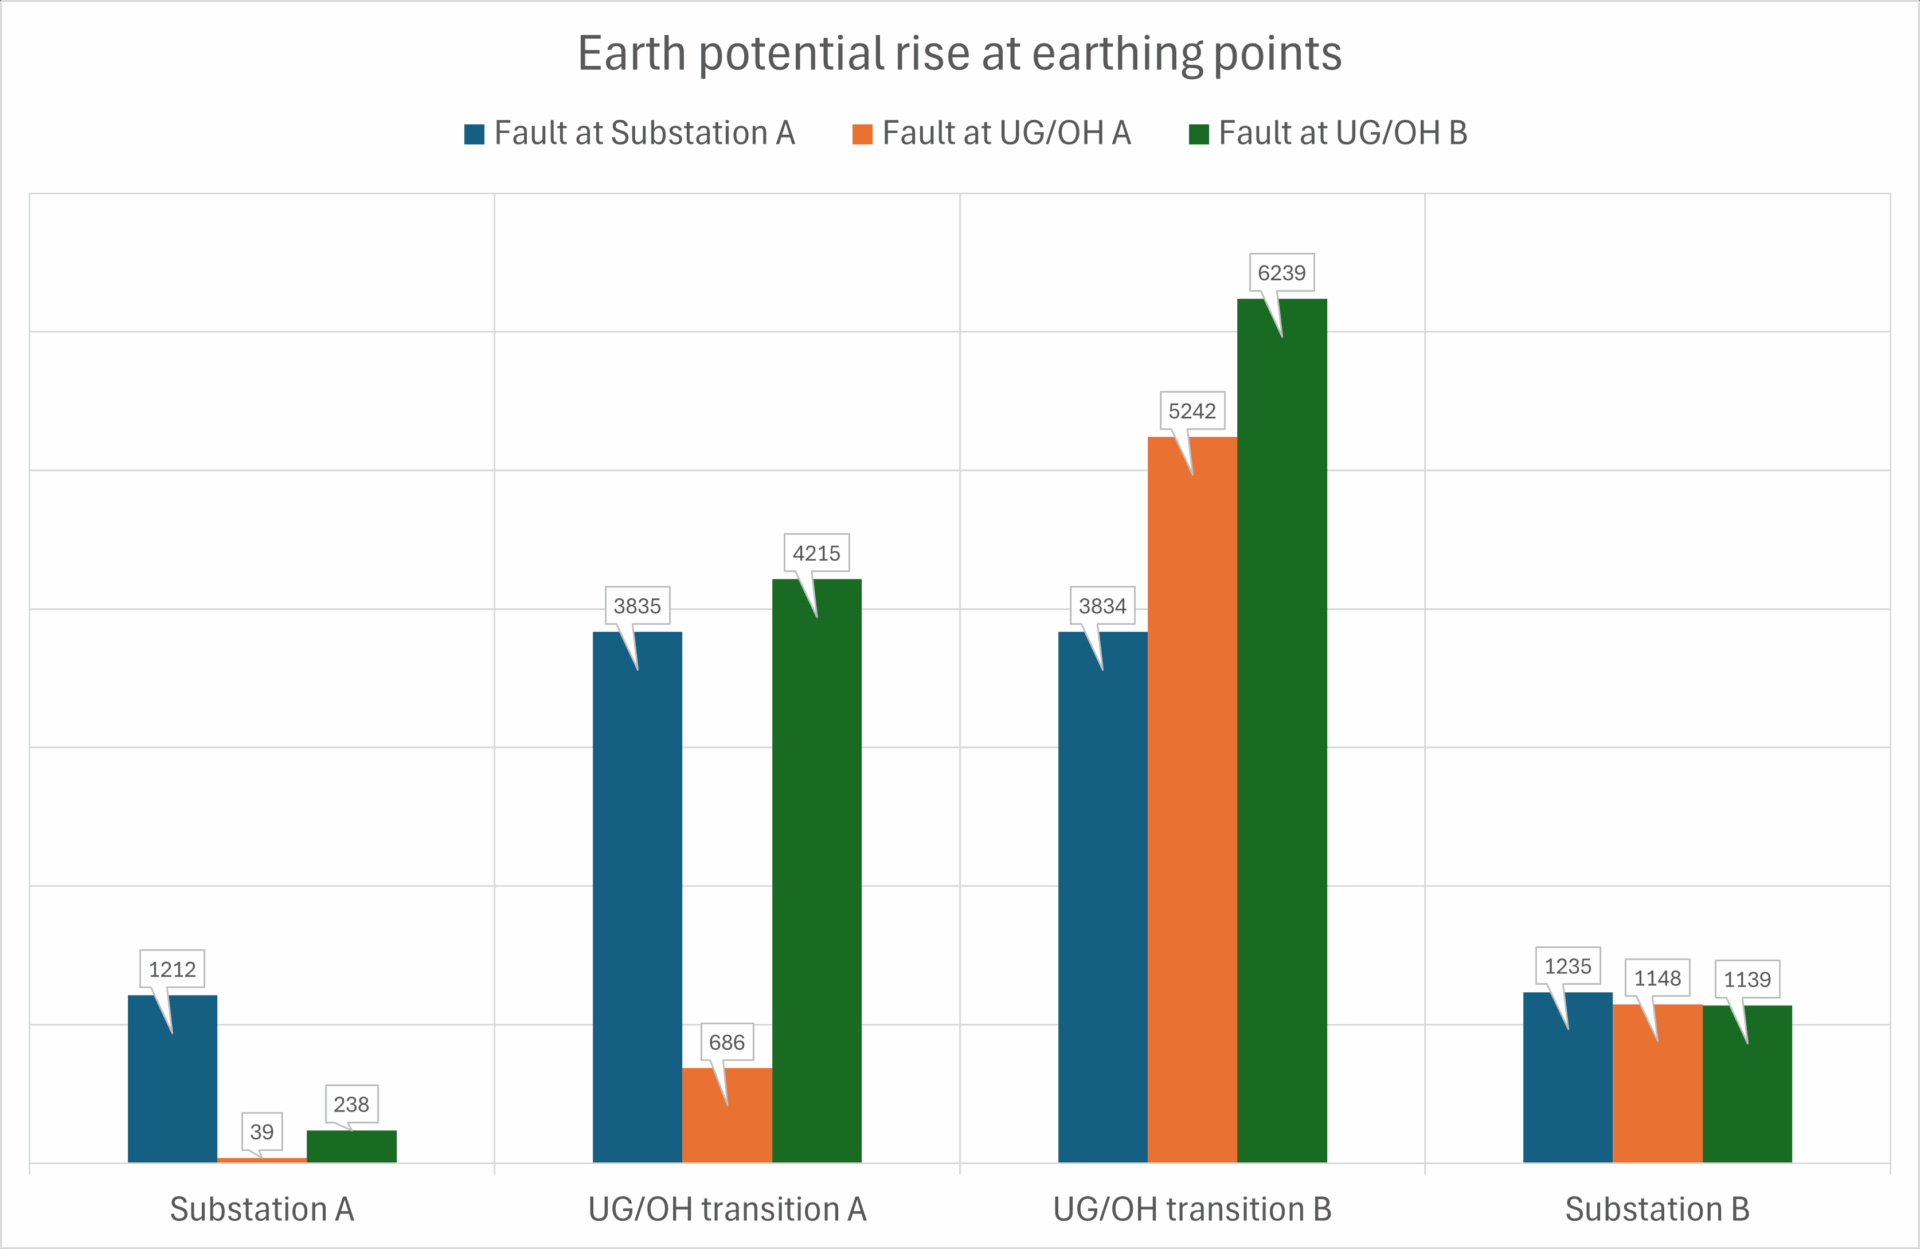
Figure 3 shows a plot of the EPR absolute magnitude at the critical earth point locations for various fault scenarios (locations). The blue bars indicate that a fault a Substation A causes low EPR’s at the substation ends, but high EPR’s at the UG/OH transitions. A fault at the UG/OH A (orange bars) causes high EPR at UG/OH B and Substation B. The highest EPR is at UG/OH transition B (green bar).
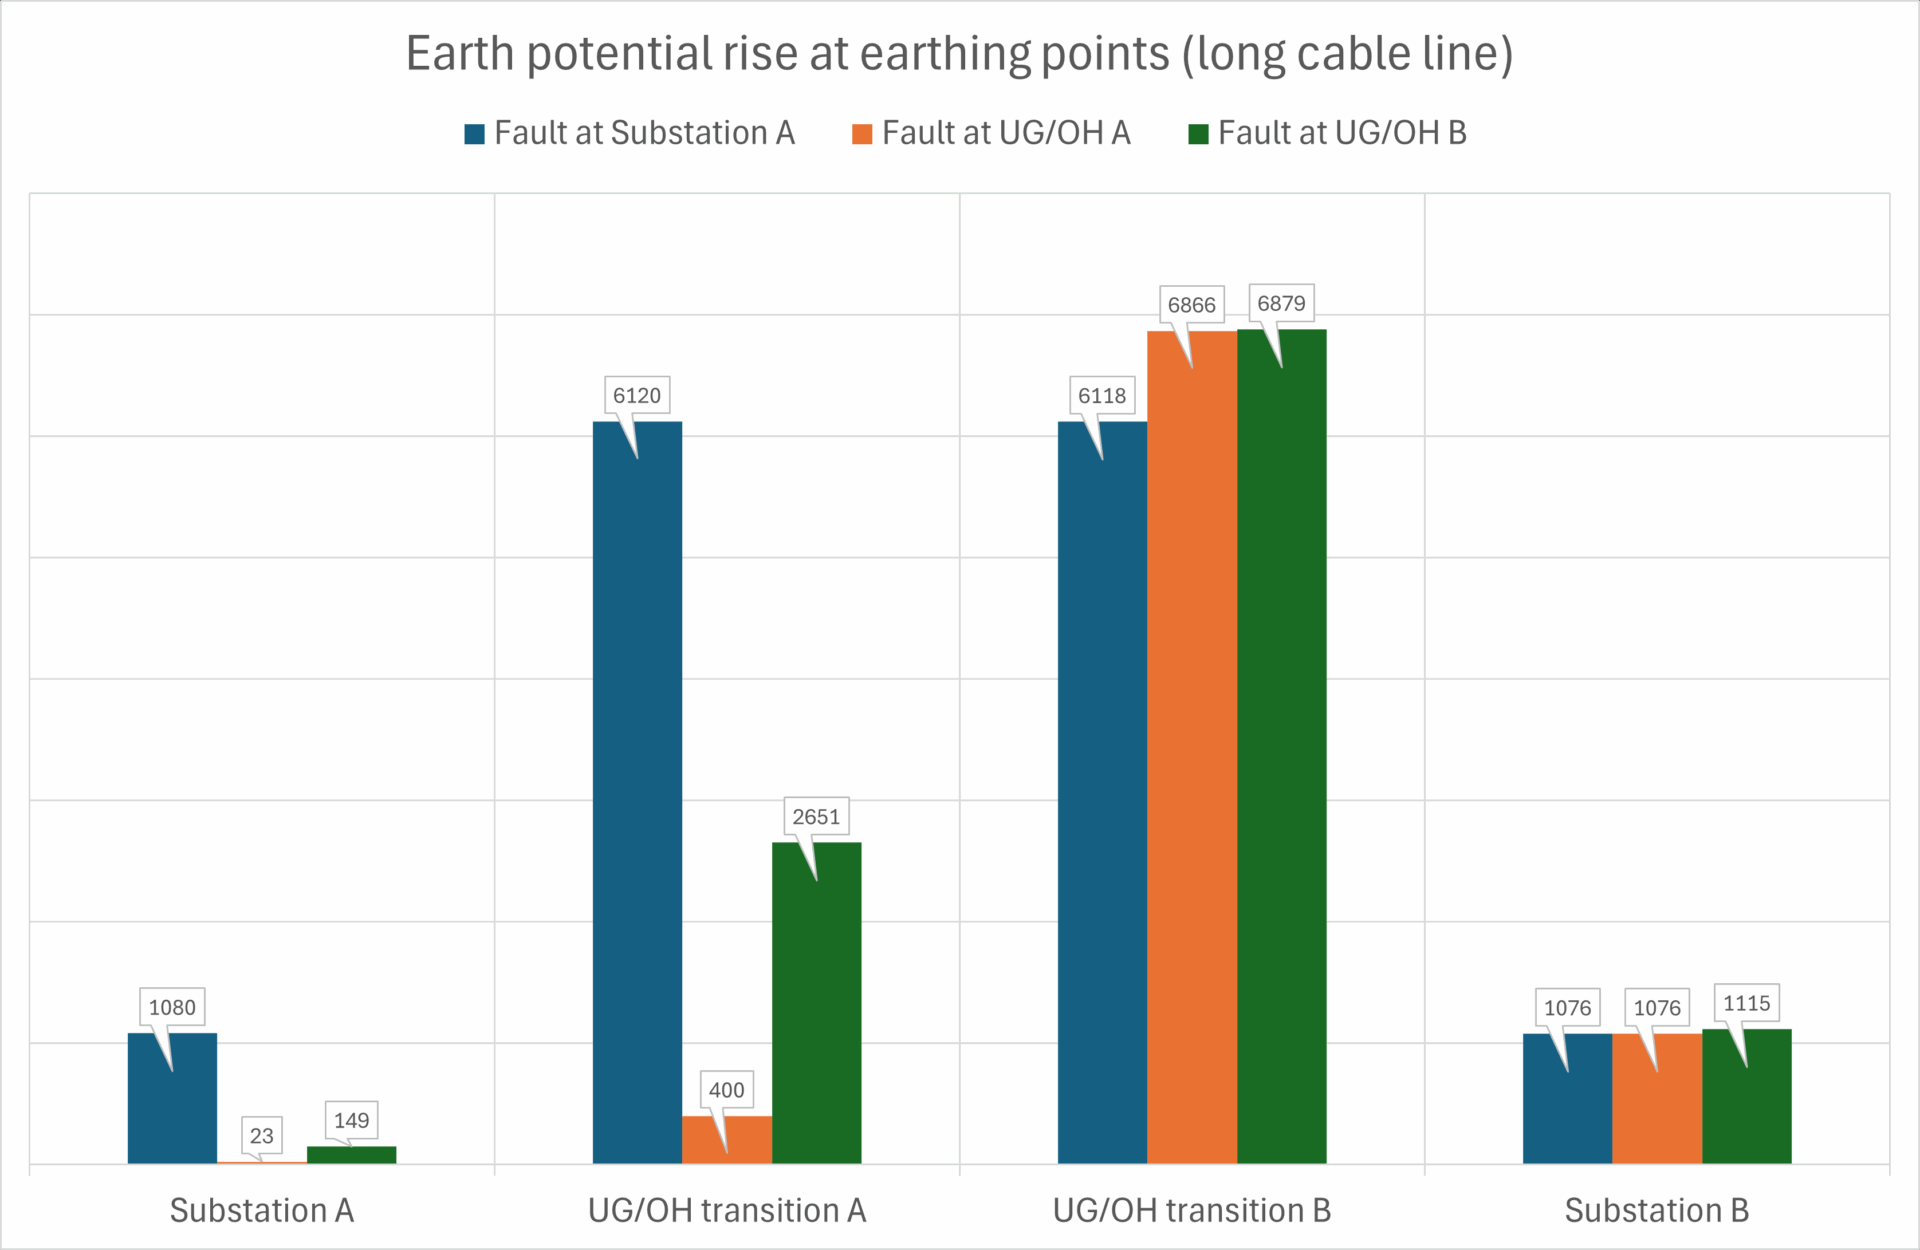
A cable link of length 9 km (3 times longer) results in an increase of 10.3 % of the highest EPR at UG/OH B, but a much larger increase of 59.5 % of the EPR at Substation A.
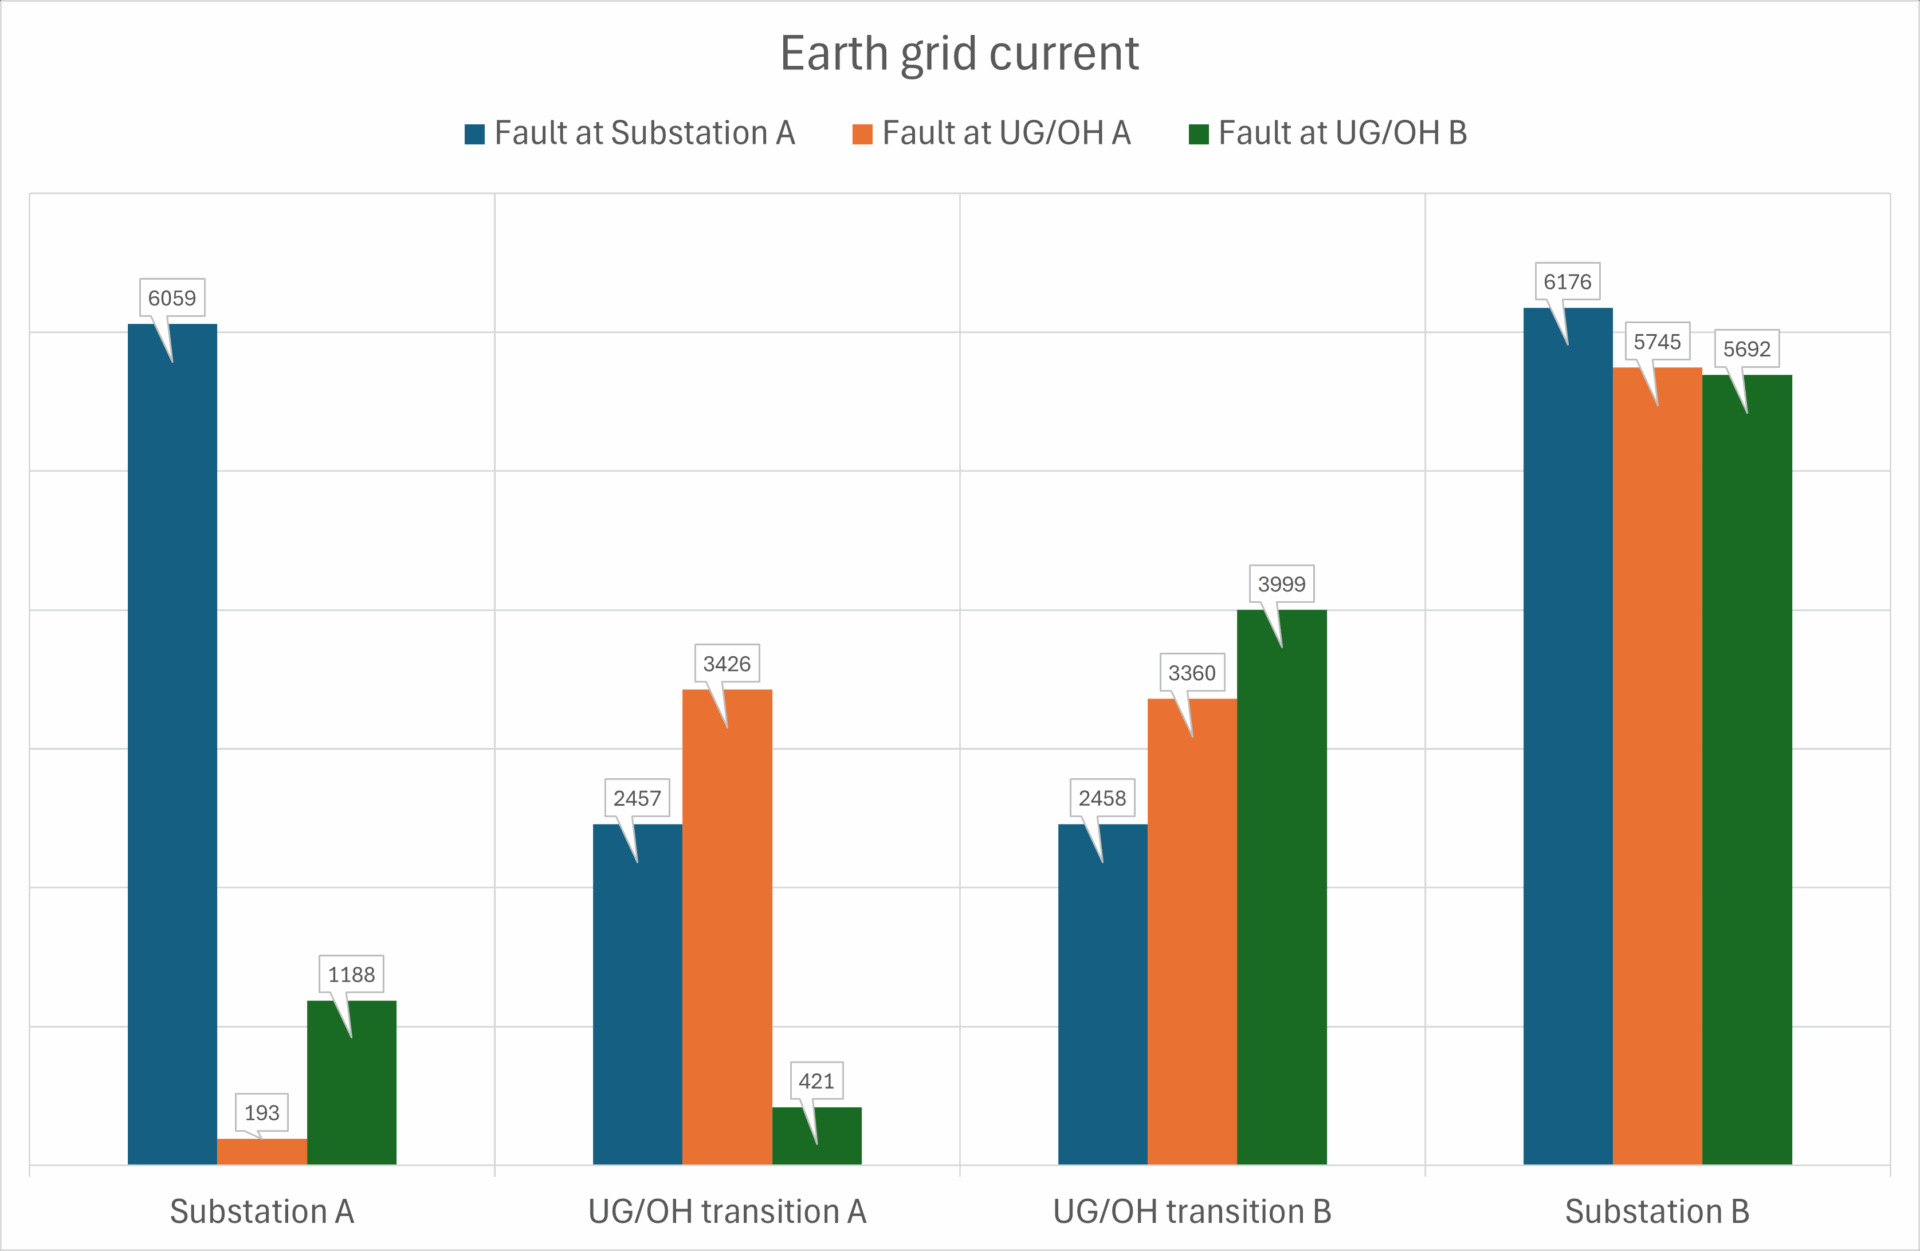
A cable link of length 9 km (3 times longer) for an earth fault at Substation A results in significant increases in the grid currents at
UG/OH transitions A and B, by up to 59.7 %.
Appendix - Calculated results
Cable length 1000 m per section
| Location | EPR (V) | Earth grid current (A) and split factor (%) |
|---|---|---|
| Substation A Fault at Substation A Fault at UG/OH transition A Fault at UG/OH transition B | 1179 -279 i 1 -39 i 140 -192 i | 5896 -1395 i (59 %) - EG LOCAL [4, 5] 3 -193 i (<1 %) - L2_EG REMOTE [35, 36] 700 -960 i (7 %) - L2_EG REMOTE [35, 36] |
| UG/OH transition station A Fault at Substation A Fault at UG/OH transition A Fault at UG/OH transition B | -2533 -2879 i 500 -469 i 4173 -596 i [NODE 30 - NODE 31] | -1623 -1845 i (16 %) - L1_EARTH POINT [9, 10] 2498 -2344 i (25 %) - EG LOCAL [4, 5] 417 -60 i (2 %) - L2_TOWER [30, 31] |
| UG/OH transition station B Fault at Substation A Fault at UG/OH transition A Fault at UG/OH transition B | 2527 +2884 i (NODE 30 - NODE 31) 4415 +2826 i [NODE 25 - NODE 26] 6164 +963 | 1620 +1849 i (16 %) - L1_TOWER [30, 31] 2830 +1811 i (28 %) - L1_TOWER [25, 26] 3951 +617 i (40 %) - EG LOCAL [4, 5] |
| Substation B Fault at Substation A Fault at UG/OH transition A Fault at UG/OH transition B | -1202 +284 i -1130 +205 i -1137 +61 i | -6011 +1420 i (60 %) - L1_EG REMOTE [35, 36] -5652 +1027 i (57 %) - L1_EG REMOTE [30, 31] -5684 +307 i (57 %) - L1_EG REMOTE [9, 10] |
Cable length 3000 m per section (long line)
The table below shows the EPR and grid currents for various fault scenarios.
| Location | EPR (V) | Earth grid current (A) and split factor (%) |
|---|---|---|
| Substation A L2_EG REMOTE[35, 36] Fault at Substation A Fault at UG/OH transition A Fault at UG/OH transition B | 1067 -170 i (EG LOCAL [4, 5]) -5 -22 i 55 -139 i (L2_EG REMOTE [35, 36]) | 5336 -850 i (53 %) -24 -110 i (<1 %) 273 -696 i (3 %) |
| UG/OH transition station A EG LOCAL [4, 5] Fault at Substation A Fault at UG/OH transition A Fault at UG/OH transition B | -5357 -2960 i (L1_EARTH POINT [9, 10]) 220 -334 i 2444 -1026 i [NODE 30 - NODE 31] | -3434 -1898 i (34 %) 1100 -1670 i (11 %) 244 -103 i (2 %) |
| UG/OH transition station B L1_TOWER [25, 26] Fault at Substation A Fault at UG/OH transition A Fault at UG/OH transition B | 5352 +2965 i (NODE 30 - NODE 31) 6465 +2311 i [NODE 25 - NODE 26] 6824 +868 i (EG LOCAL [4, 5]) | 3430 +1901 i (34 %) 4138 +1481 i (41 %) 4374 +557 i (44 %) |
| Substation B L1_EG REMOTE [30, 31] Fault at Substation A Fault at UG/OH transition A Fault at UG/OH transition B | -1071 +103 i -5354 +513 i -1115 +31 i (L1_EG REMOTE [9, 10]) | -5354 +513 i (54 %) -5439 +865 i (54 %) -5574 +155 i (56 %) |

Fault at Substation A
- Consists of a single line.
- Create 1 section of CASE 7 and enter the data for that.
- Copy that section by pressing Copy Section
- Go back to the first section and press Add Section. Change the new section to CASE 6 and enter the data.
| Section | Inputs | |
|---|---|---|
| 1 | 1 |  |
| 1 | 2 |  |
| 1 | 3 |  |
Fault at UGOH transition A
- Consists of two lines.
- Create an overhead line section for Line 1 as CASE 7 and enter the data for that.
- Copy Line.
- Go back to Line 1 and press Add Section. Change the new section to CASE 6 and enter the data
| Line | Section | Inputs |
|---|---|---|
| 1 | 1 | Match all the inputs
 |
| 1 | 2 |  |
| 2 | 1 |  |
Fault at UGOH transition B
Steps to create this arrangement:
- Consists of two lines.
Create an overhead line section for Line 1 as CASE 7 and enter the data for that.
- Copy Line.
Go back to Line 1 and press Add Section. Change the new section to CASE 6 and enter the data.
| Line | Section | Inputs |
|---|---|---|
| 1 | 1 | Match all the inputs
 |
| 2 | 1 |  |
| 2 | 2 |  |
