Downloads:
Table of Contents
Introduction
This tutorial explains how to use the Cable Pulling module in Cable Pro Web software.
Prior to the installation of cables, it is of upmost importance to perform tension and sidewall pressures calculations. The tensions and sidewall pressures should not exceed the manufacturer’s specified limits to avoid damage to the cables.
The tensions and sidewall pressures are affected by the following main factors:
– Sizes of cables and the quantity.
– Route length and bends.
– Method of pulling and formation, and the direction of the pull.
– Friction between cables and surfaces.
The theory for cable pulling calculations are explained in the Help Manual and the article explaining how to calculate cable pulling tensions.
Example – Pulling route
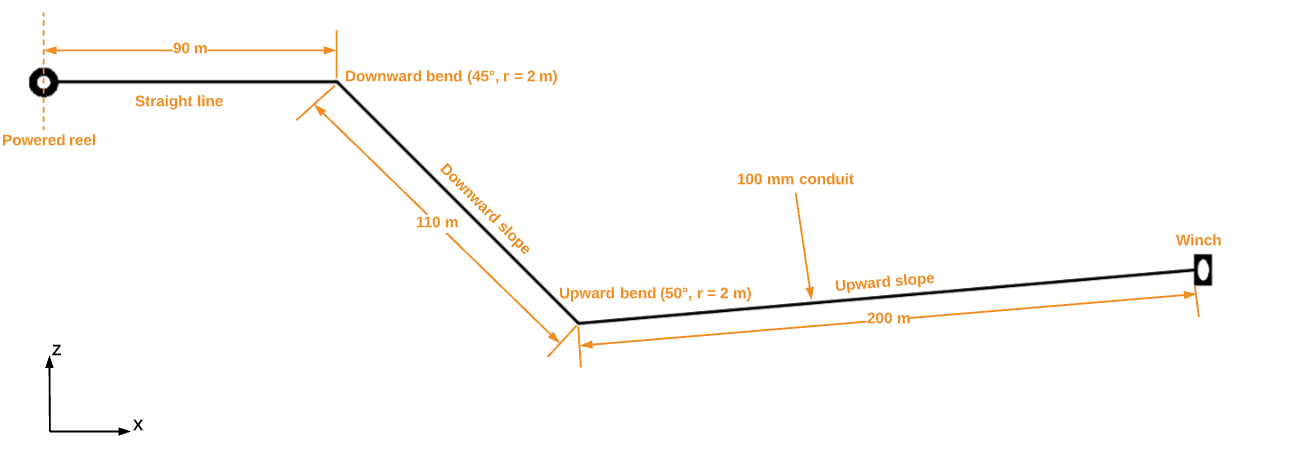
Three cables will be pulled in trefoil formation inside a 100 mm conduit along the installation route depicted in Figure 1. The route consists of 3 straight sections (1 horizontal, 1 downward slope and 1 upward slope) with 2 bends. There is a powered reel at one end (so reel back tension is 0 N) and a winch at the other.
For this installation the following calculations and checks are needed:
- Tension and sidewall pressure limits are not exceeded.
- Cable clearances and jamming probability in the conduit.
- The above for both forward and reverse pull directions.
Next, we will explore the main user interface and collect the input data of the software.
Software inputs - Overview
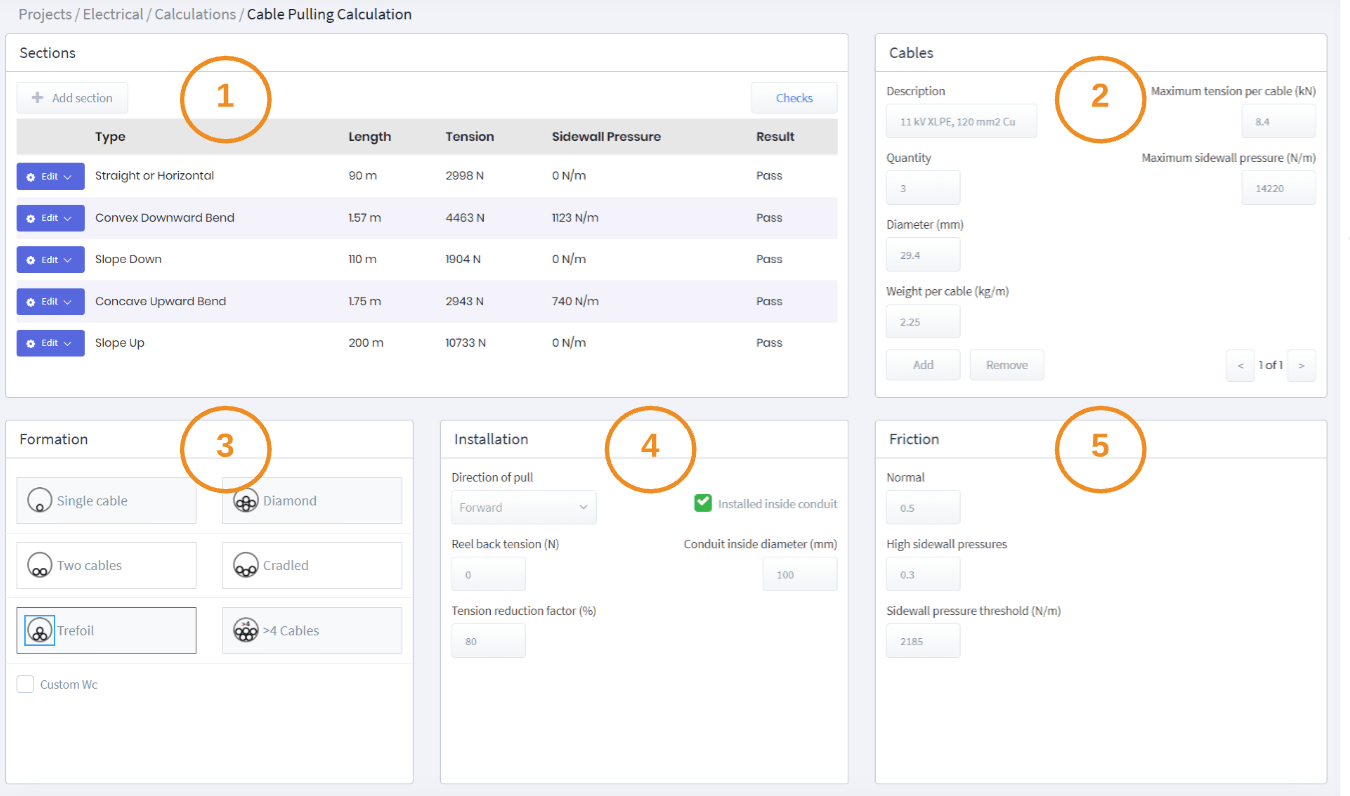
There are five main sections to the software’s user interface requiring data from the user:
① Sections– A cable route is divided into sections, and each is added to the table.
② Cables – Enter the quantity of cables and physical properties. Refer to the cable manufacturers data. Multiple cable types are possible.
③ Formation – Match the arrangement in which the cable(s) are pulled.
④ Installation – Specify the conduit/duct dimensions, direction of pull, reel back tension and reduction factor.
⑤ Friction – Enter the values for friction along the route including for the bends which result in high sidewall pressures.
Sections data
The cable pulling route shown in Figure 1 has been divided into sections.
The data to enter for the sections is shown below in Table 1.
Table 1 – Sections data
| No. | Type | Input values |
|---|---|---|
| 1 | Reel Back Tension | 0 N |
| 2 | Straight | Length = 90 m |
| 3 | Convex Downward Bend | Angle = 45°, Bend radius = 2 m |
| 4 | Slope Down | Length = 110 m, Angle = 45° |
| 5 | Concave Upward Bend | Angle = 50°, Bend radius = 2 m |
| 6 | Slope Up | Length = 200 m, Angle = 5° |
Click on the “Add Section” button to include and configure each section of the cable route.

Cables data
The cables (Figure 4 below) are 11 kV single core with 120 mm2 copper conductors which will be pulled in trefoil formation inside the duct.
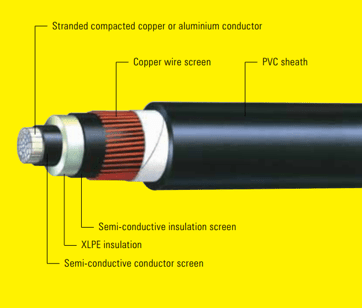
The relevant data has been taken from the cable manufacturer’s catalogue.
Table 2 – Cable’s data
| Parameter | Value | Source |
|---|---|---|
| Cable diameter | 29.4 mm | Manufacturer’s catalogue (see next page) |
| Weight per cable | 2.25 kg/m | |
| Maximum tension per cable | 8.4 kN | |
| Maximum sidewall pressure | 1450 kg/m 14220 N/m |


The overall maximum permissible pulling tension on the cables is given as follows:
Where Rf is the Tension Reduction Factor in percentage, N are the number of cables (3) and T allowable is the maximum allowed tension per cable (8,400 N). Tension reduction factor is applied for multiple cables when considering that the forces are not evenly distributed and in this example is assumed to be 80%.
The overall maximum permissible pulling tension becomes 3 x 8,400 x 80% = 20,160 N
Formation and Installation data
The formation input affects the weight correction factor which is used internally by the software for calculations so what is selected must match the way the cables will be pulled. In this example, the three cables will be bunched as a Trefoil bundle and hauled at once.
The three cables will be hauled inside a conduit of 100 mm diameter.
Friction data
The coefficient of friction has a large impact on the pulling tension calculations. Note that static (stationary) friction is higher than dynamic friction therefore it is not recommended to stop during a cable haul.
Typically, the coefficient of friction will vary between 0.1 and 1 where lubrication is used and can exceed 1 for un-lubricated pulls. The coefficient of friction measured in bends with high sidewall pressures is approximately half the value of straight runs.
The friction data has been taken from the Standard “IEEE Guide for the Design and Installation of Cable Systems in Substations” (IEEE 525-2016).
Table 3 – Friction data
| Parameter | Value | Source |
|---|---|---|
| Dry cable or conduit | 0.5 | IEEE Std. 525-2016 |
| Well-lubricated cable and conduit | 0.15 - 0.35 |
For this example, the Normalcoefficient of friction is taken as 0.5.
It has already been explained the coefficient of friction reduces typically by half from normal during a bend where the sidewall pressure exceeds a pre-defined limit. This fact is being included in this example therefore friction for High sidewall pressures is 0.3.
Results
The calculated tension and sidewall pressures are displayed in the Sections table and the Results are checked automatically by the software.

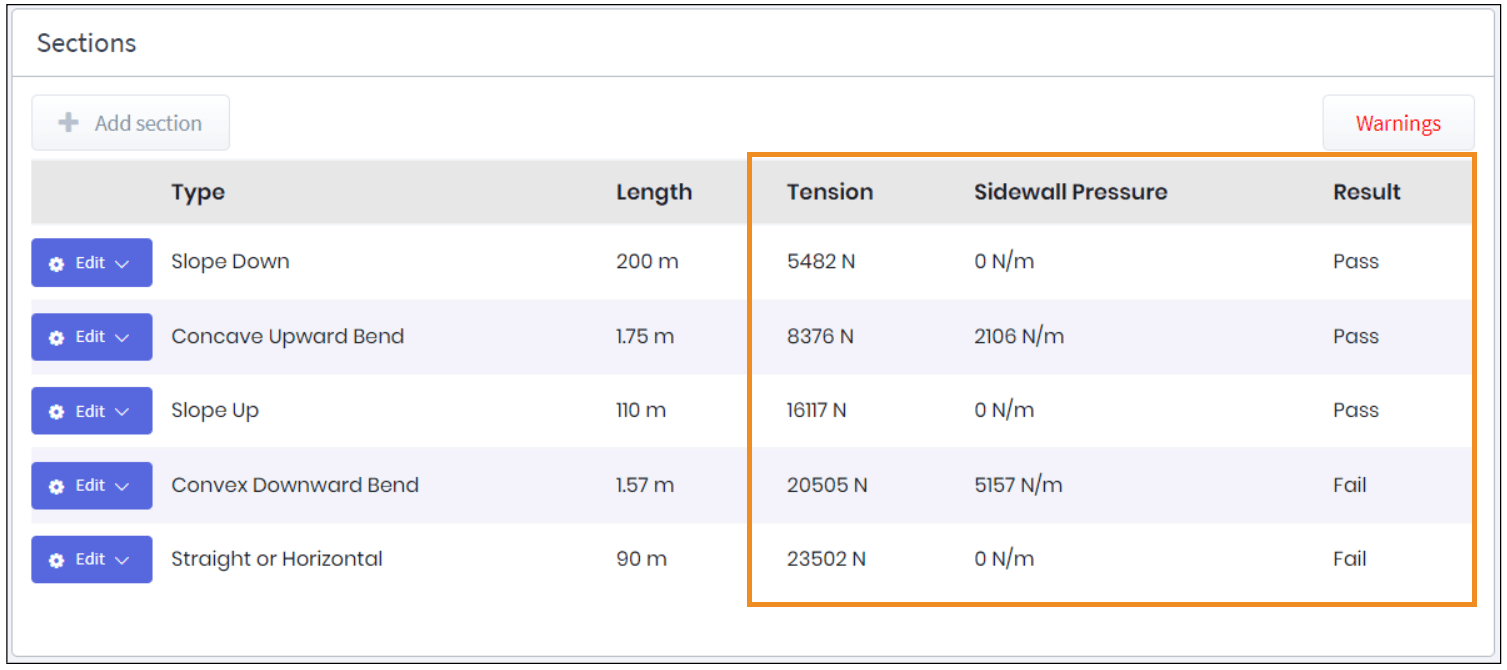
The maximum tension for a forward direction pull is 10,733 N and maximum sidewall pressure is 1123 N/m, while for Reverse Pull Analysis, maximum tension is 23,502 N and maximum sidewall pressure is 5157 N/m. Note that the Slope Down section in the forward direction significantly reduces the tension due to the gravity effect.
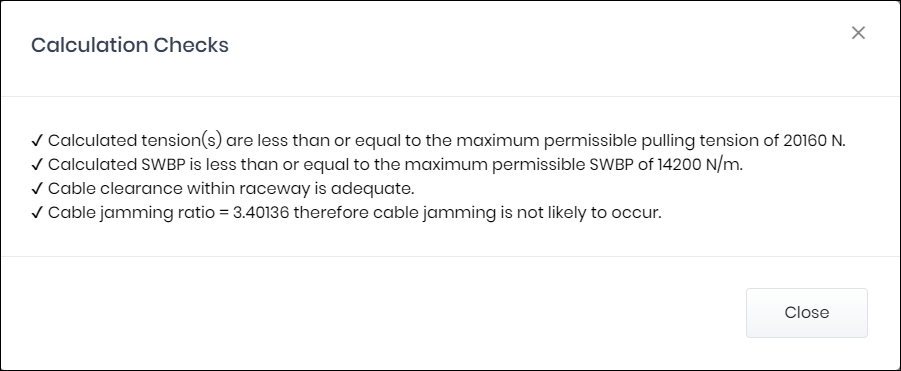
There are no warnings shown for forward pull direction, however, for the reverse pull direction, the maximum tension has exceeded the specified limit andis shown as a warning. By pressing the Checks button, the Calculation Checks window is displayed.
Summary
In summary, the maximum tensions and sidewall pressures on the cables are lower than the maximum limits for forward pull direction.
The cables clearance inside the conduit is deemed to be adequate and cable jamming probability calculated as not likely to occur.
The design is acceptable for the forward pull direction, and there should not be damage caused to the cables during installation.
