Downloads:
Table of Contents
Introduction
The Protection Coordination module in Cable Pro WebTM allows the user to conduct a protection coordination study with over 5000 protective devices from different manufacturers. The protective devices can be easily selected, and the time current curves will be generated automatically.
The device settings which are designed as per manufacturer catalogues are used to plot the time current curves according to user adjustments. The module also features two functions – Coordination criteria and Sequence of operation – to help the user achieve the coordination between devices.
A detailed report including all device information and settings is able to be generated, which can be used as a commissioning report as well.
An example system
To demonstrate how to use the Protection Coordination to achieve selectivity between devices, an example system is investigated. As Figure 1 shows, coordination is supposed to be achieved between an incoming circuit breaker protecting a distribution board and another circuit breaker protecting an outgoing distribution circuit.
The requirement is to specify the device settings that will achieve coordination for all levels of prospective fault current as per the Standards or the manufacturer guidelines. In the example herein the coordination criteria is based on Standard AS/NZS 3000:2018.
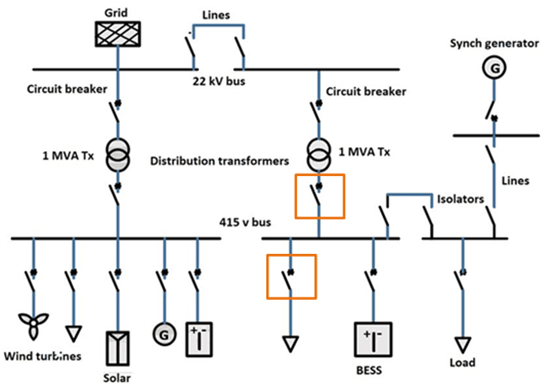
· Rated currents and Max. prospective fault current
The rated load current of the distribution circuit is 239 A while that of the incoming circuit is 694 A. The maximum prospective fault current at the outgoing distribution circuit is 7.2 kA.
· Protective devices
The circuit breaker for protecting distribution board is shown in Table 1.

The circuit breaker for protecting outgoing circuit is shown in Table 2.

Add protective devices
Go to any existing project or create a new project. Then create a new calculation with the calculation type of Protection Coordination.
- Add the upstream protective device
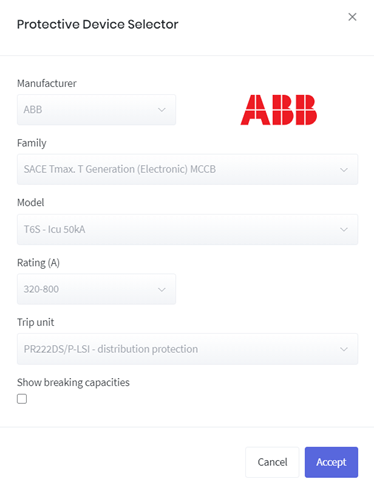
When first opening the Protection Coordination calculation, a popup for selecting the protective device will be shown – Protective Device Selector. With the Protective Device Selector, the upstream circuit breaker shown in Table 1 can be selected.
- Add the downstream protective device
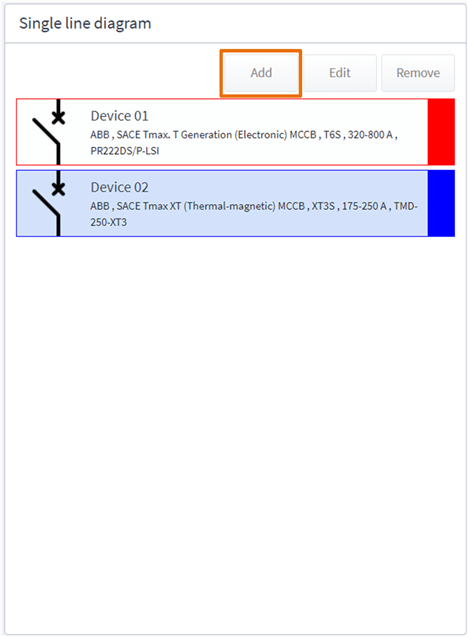
Click Add device in the top of Single line diagram to open the Protective Device Selector again and add the device protecting outgoing circuit shown in Table 2.
Create coordination curves as per Standard
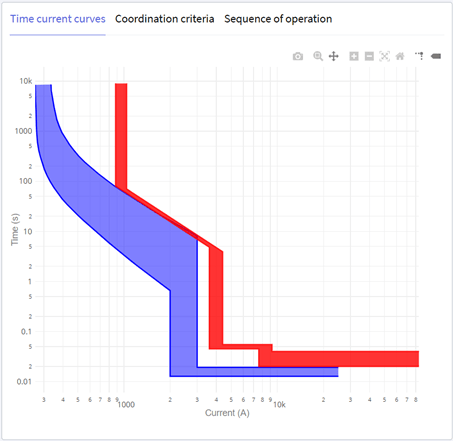
After adding the devices, the time current curves of devices will be shown automatically with default device settings. To achieve coordination, enough separation should be maintained between time current curves.
A useful tool is provided in the Protection Coordination calculation to help the user display the required spacing along with original time current curves – Coordination criteria. This tool visualises the coordination requirements of a Standard. The following steps will show you how.
- Coordination requirements stated in AS/NZS 3000:2018
According to Clause 2.5.7.2.3 (a) (ii) and (iii), discrimination is deemed to be achieved if C1 ≥ 1.5 × C2 when the rating of C2 is less than 800 A. C2 is the downstream time current curve while C1 is the upstream time current curve.
- Create the coordination curve
An imaginary curve which indicates the coordination requirement can be created with Coordination criteria. Click Add in the Coordination criteria tab to add a new row in the table, which represents a coordination curve in the plot.
The coordination curve will be based on the selected device original curve. In this case, the Outer curve of Device 02 should be selected as we desire to make sure there will be enough spacing between downstream outer curve and upstream inner curve.

Specify Current multiplier as 1.5 to represent the coordination requirement from AS/NZS 3000:2018. Leave Time multiplier and Time adder (s) as default. The created coordination curve is shown in Figure 6 in blue as a line.

Adjust device settings to achieve coordination
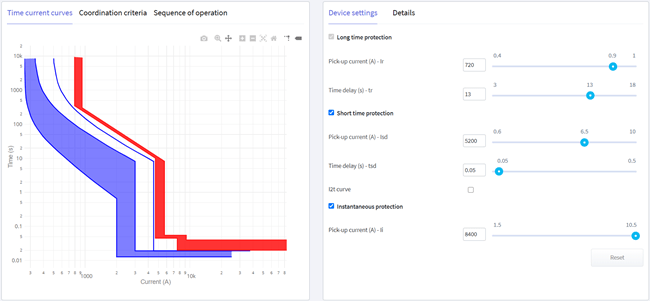
From Figure 6, for a fault current between 880 A and 4500 A (approximately), the coordination fails since the upstream device curve crosses the coordination curve (blue line) of the downstream device.
As per AS/NZS 3000:2018, discrimination need not apply above the arcing fault current (Iarc). To be conservative, arcing fault current equals to 60% of prospective fault current which is 7200 × 0.6 = 4320 A. Therefore, the device settings need to be adjusted to make sure the time current curves of upstream are on the right side of the coordination curve under 4320 A.
The rating (long time protection pick up current) of the upstream device is changed to 720 A to have adequate margin from the rated load current (694 A). The long-time protection time delay setting, and short time protection pick-up current are changed to 13 s and 5200 A respectively. Now discrimination between these two devices is achieved and is fully compliant.
Determine the sequence of operation
Sometimes the coordination needs to be achieved based on tripping time and not only current. The sequence of operation thereby needs to be determined at the specific fault level.
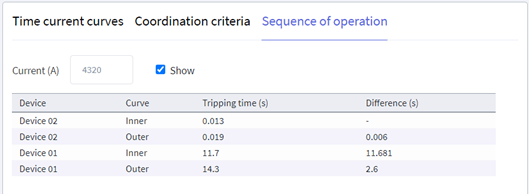
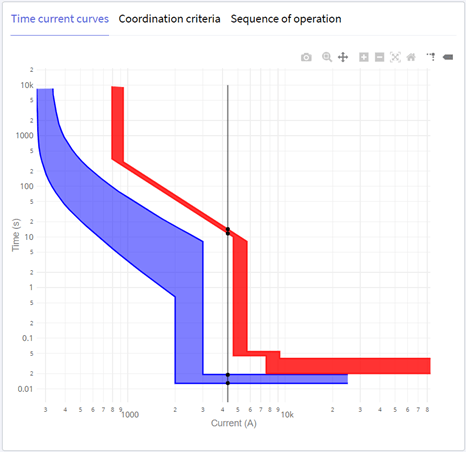
In the Protection Coordination module, the user can specify the current whether they want to know the sequence of operation. The tripping times and their differences will be displayed in the table and an auxiliary curve will be shown in the graph to indicate the sequence.
As Figure 8 shows, the minimum tripping time difference between upstream and downstream devices is 11.68 s at arcing fault current (Iarc), 4320 A.
References
[1] AS/NZS 3000:2018, Wiring Rules.


