Downloads:
Table of Contents
Introduction
When circuits cross each other, each circuit acts as a heat source that influences the other cable’s ratings. The vertical distance between the crossing circuits and their relative crossing angle are important parameters that determine crossing ratings. Mutual heating between multiple buried cable circuits near one another are at a maximum when they are in parallel which therefore leaves their current ratings at a minimum. When circuits are at right angles to one another, the thermal interaction is at a minimum and thus the cable current ratings are at a maximum.
The Cable Crossings module in ELEK Cable HV Software™ allows the user to model multiple buried circuits at various depths and estimate the permissible current and derating factors depending on whether the circuits are in parallel with one another or whether they cross each other at a specific angle.
Capabilities:
- Capable of modelling multiple (2 or more) cable circuit crossings in the same installation.
- Cable crossings are supported for direct buried, buried ducts and buried in backfill underground.
- Any cable type (single core and multi-core) and any number of cables.
- Heat from buried steam pipes can be included in the modelling.
- Crossing angles from 0 to 179 degrees.
As per the IEC Standard, the following limitations apply:
- Transient analysis is not supported.
- Temperature based ratings and unequally loaded analysis is not supported.
- Cyclic or emergency loadings are not supported.
The following practical example will show you how to use the Cable Crossing module.
Example: Single core 132 kV cable circuit crossing a three-phase multicore 22 kV cable
The objective of the example is to show the current ratings for both circuits when the 22 kV circuit crosses at angles ranging from 15-90°.
Table 1 and Table 2 display the cable data for a single core 132 kV cable and three core PVC-SWA-PVC sheathed cable, respectively.
Table 1. – 132 kV Cable data
| Nominal section area (mm2) | Conductor diameter (mm) | DC conductor resistance (Ω/km) | Thickness of Insulation (mm) | Copper screen | Nylon sheath | |
|---|---|---|---|---|---|---|
| Sectional area (mm2) | Outside diameter of conductor screen (mm) | Outside diameter (mm) | ||||
| 1000 S1 | 39.7 | 0.0176 | 20 | 296.13 | 92.3 | 104.6 |
1 S: segmental stranded
Table 2. – 22 kV Cable data
| Nominal section area (mm2) | Conductor diameter (mm) | DC conductor resistance (Ω/km) | Thickness of Insulation (mm) | Copper screen | PVC sheath | |
|---|---|---|---|---|---|---|
| Sectional area (mm2) | Outside diameter of conductor screen (mm) | Outside diameter (mm) | ||||
| 400 | 23.6 | 0.047 | 5.5 | 22.7 | 39.6 | 105.6 |
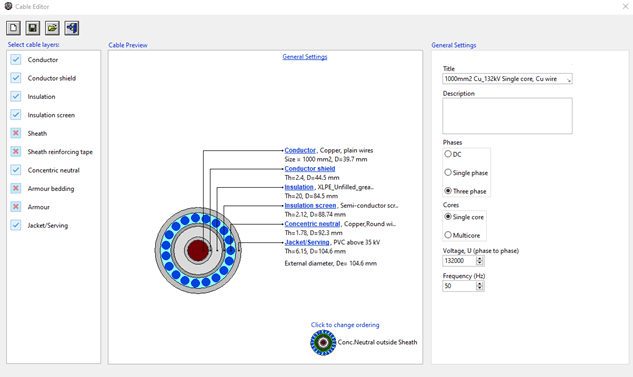
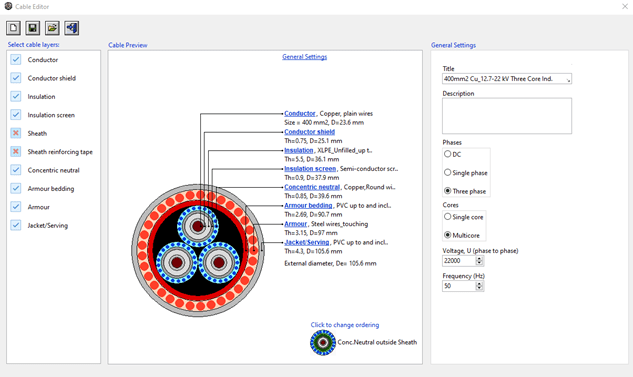
Figures 1 and 2 display the cable models in the Cable Model Editor of Cable HV™.
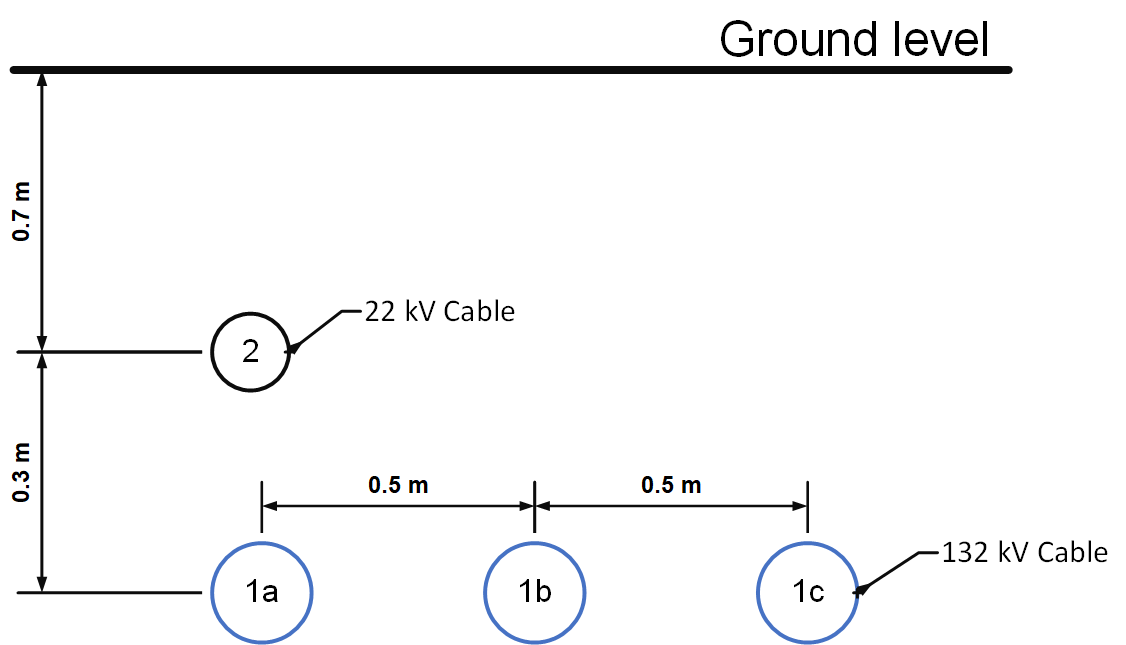
The 132 kV single core cables are buried at 1 m with a phase spacing 0.5 m. The 22 kV multi-core cable is buried at 0.7 m.
Figure 1. – Cable model for 132 kV single core cable

Figure 2. – Cable model for 22 kV three core cable

Figure 3. – Diagram of buried circuits (not to scale)

1. Obtain the isolated current ratings
Based on the cable installation requirements, the current rating can be calculated.
Figure 4. – Obtaining current values

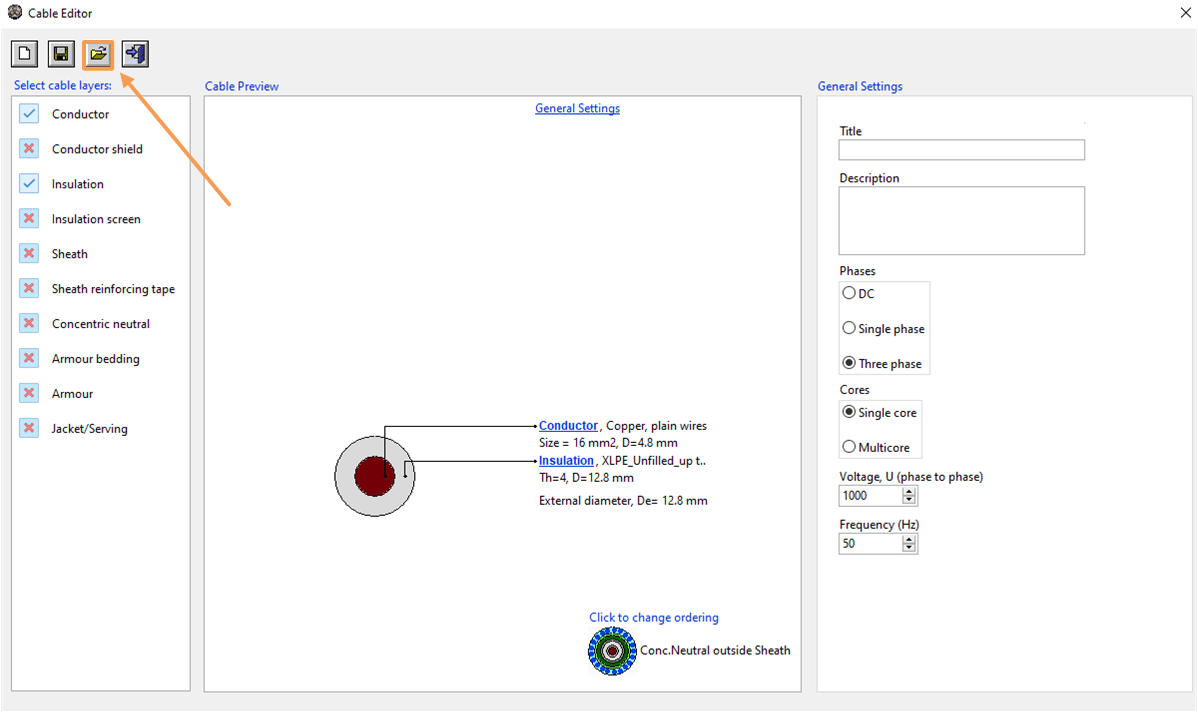
Select the Cable Models Show button at the top left-hand corner of Cable HVTM. This will open a navigator that allows you to
add new or edit existing cables. For the example case, the cables can be selected from Cable HV’s built-in cable database. Click
on the manila folder to use pre-set cables as shown by figure 5.
Figure 5. – Cable editor window

2. Configure the cable installation

After configuring the cables, select the Buried installation. This will bring up a new box as shown by figure 6 displaying the cables
underground along an x and y axis. To add multiple cables, click the Add button and select the Cable model number that you wish
to add. Adjust the depth measurements as per the example instructions.
Figure 6. – Cable installation with trefoil and three core cables
When both circuits are assumed to be isolated, the current values for the 132 kV and 22 kV are 690 A and 593 A respectively. By selecting the buttons that read Equally loaded and Unequally loaded, different current values are produced. Table 3 displays the current values for each scenario.
Table 3. – Current ratings dependent on loading
| 132 kV Circuit (A) | 22 kV Circuit (A) | |
|---|---|---|
| Isolated Ratings | 690 | 593 |
3. Using the Cable Crossings module

To use the Cable Crossings module, the Isolated ratings button must be selected. Once selected, the cable cross angle can
be altered. As per figure 7, click on Cable A of circuit 2. Click the Edit button to change the cross angle. For this example,
a value of 15° is selected initially.
Figure 7. – Cable Crossings top-down module window at 15°
There is no difference in derating factors when a small angular change has been made between 0-15°. Table 4 displays the values for each angle change at intervals of 15°. Figure 8 displays a plot showcasing the relation between the change in derating factor and angle whilst figure 9 displays the relation between the permissible current and cross angle.
Table 4. – Current and derating factor from cross angle
| 132 kV Cable | 22 kV Cable | Cross Angle (°) | ||
|---|---|---|---|---|
| Permissible Current (A) | Derating Factor | Permissible Current (A) | Derating Factor | |
| 579.1 | 0.84 | 552.3 | 0.93 | 15 |
| 619.4 | 0.9 | 569.9 | 0.96 | 30 |
| 619.4 | 0.9 | 569.9 | 0.96 | 45 |
| 619.4 | 0.9 | 569.9 | 0.96 | 60 |
| 619.4 | 0.9 | 569.9 | 0.96 | 75 |
| 621.6 | 0.9 | 570.9 | 0.96 | 90 |
4. Results
From figure 8, there is a significant difference in the derating factor between angles 15-30° where the derating factor increasing linearly. Between 30-90° the derating factor remains relatively constant for both the single and multi-core cables (this is for this example and may not be the case for other examples). In Figure 9, the current increases linearly between 15-30° and then remains constant between 30-75° with a slight linear increase at an angle greater than 75°.
5. Creating a report
On the Cable Crossing Module as per figure 7, click the Report button to generate a PDF report containing the cables’ ratings, results and a cable cross diagram. Figure 10 shows the type of data compiled by the PDF report.
References
[1] E. Fernandez, J. Patrick & E. Chen, “Derating for Cable Crossings,” 2020. [Online]. Available: https://elek.com/wp-content/uploads/2020/07/Derating-for-Cable-Crossings_Cable-HV-Software.pdf.
[2] Cable HV Software, Version 4.0. Visit: https://elek.com/electrical-software/elek-cable-high-voltage/


