This paper presents calculation results for an earthing system in 3-layer soil and examines the influence of the upper soil resistivity, upper soil layer thickness, middle soil resistivity, middle soil thickness and lower soil resistivity on the calculated earthing grid resistance.
The results are calculated using SafeGrid Earthing software and these are compared with results of a study done using CDEGS Software [1].

Figure 1. Surface voltages plot for the first test with upper layer soil resistivity of 10 Ω.m
Grid model
A simple grid was modelled with properties as:
SafeGrid Earthing software does not assume an equipotential grid therefore the complex series impedances of the grid conductors (assuming the conductivity of steel) were also considered. The frequency of excitation (fault) current was 50 Hz.
Multilayer soil model
Unless otherwise specified, each test will have the following soil parameters:
Influence of the upper soil layer
The effect of the upper layer on grounding resistance was examined by varying:
- Resistance of the upper layer between 10 and 70 Ω.m.
- Thickness of the upper layer between 10 m and 70 m.
The soil model for the first test is given in Figure 2, and the soil model for the second test is given in Figure 3.
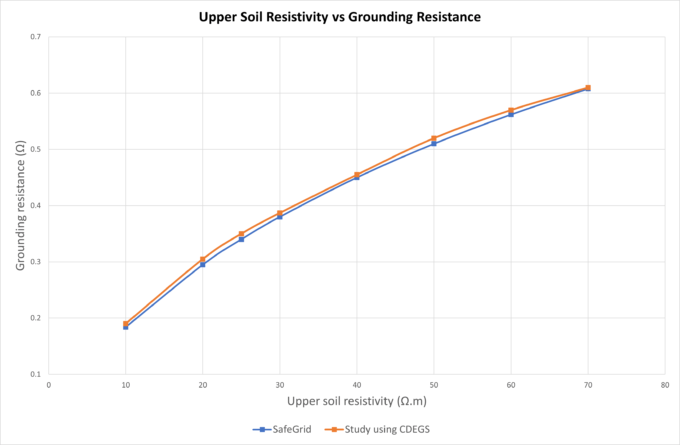
The calculated results which are given in Figures 4 and 5 were compared with referenced study [1].

Figure 2.Soil model – varying the upper layer resistivity

Figure 3: Soil model – varying upper layer thickness
Figure 4 shows as upper layer resistivity increases so too does grid resistance. The results using SafeGrid software are quite close to the referenced study [1] which was using CDEGS software, with only a maximum difference of 3.28%.
Figure 5 shows as upper layer thickness increases the grid resistance goes down. This is because the resistivity of upper layer is lower than the middle layer. The results using SafeGrid software are quite close to the referenced study [1] which was using CDEGS software, with only a maximum difference of 2.14%.

Figure 4.Plot showing the effects of upper soil resistivity on grounding resistance

Figure 5. Plot showing the effects of upper soil thickness on grounding resistance
Influence of the Upper layer
The effect of the middle layer on grounding resistance was tested by measuring the following:
- Resistivity of the middle layer, ranging from 50 to 700 Ω.m.
- Thickness of the middle layer between 10 m and 80 m
The soil model for the first middle layer test can be seen in Figure 6, and the soil model for the second can be seen in Figure 7.

Figure 6. Soil model – varying middle layer resistivity

Figure 8 shows that as the middle soil resistivity increases, so does the grounding resistance. However, the curve also begins to flatten out at around the 300 Ω.m point. This is due to the diminishing effects of changes in the middle soil layer resistivity. Additionally, Figure 6 shows that the results in SafeGrid and the results from the referenced study using CDEGS [1] are very close, where the maximum difference between two values for this simulation is 1.81%.
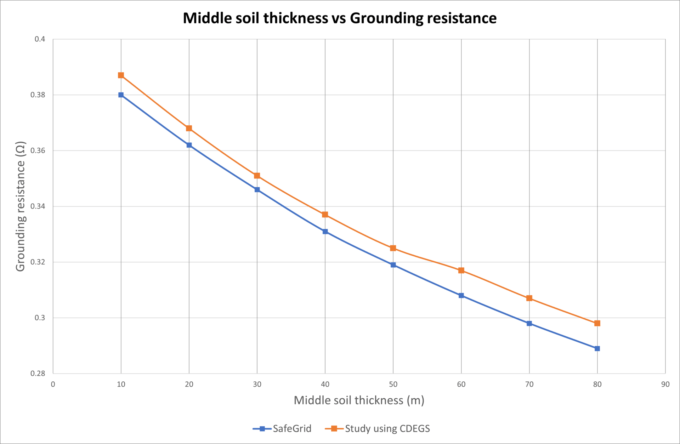
Figure 9 shows that as the thickness of the middle soil layer increases, the grounding resistance decreases. While this is similar to the trend of increasing thickness of the upper soil layer, note that the reduction of grounding resistance is actually much lower than the upper soil layer, due to the less prominent diffusion effect the middle soil layer has on the grid. Figure 8 also shows that the results between the simulation in SafeGrid and the simulation in the referenced study [1] using CDEGS are similar. The maximum difference between values for this simulation is 3.02%.

Figure 8. Plot showing the effects of middle layer resistivity on grounding resistance

Influence of the Lower Layer
The effect of the lower layer on grounding resistance was tested by measuring differing resistivities of the soil, ranging from 500 to 2000 Ω.m. Varying thickness is not measured, as it is assumed for any given soil model that the lowest layer has an infinite thickness.
A soil model for the lower layer resistivity test can be seen in Figure 10 below.

Figure 11 shows the effects of lower soil resistivity on grounding resistance. As lower soil resistivity increases so does the grounding resistance. Note that this increase gradually decreases as the resistivity gets higher. This is due to the lesser diffusion effect the lower soil layer has on the grid. If the resistivity were to increase further, the upper and middle layers would play a stronger role in diffusion, meaning that the curve would eventually flatten out. Additionally, Figure 10 shows that the results of the simulations in SafeGrid and in the referenced study [1] are close. The greatest difference in data points for this simulation is only 2%.

Conclusion
This study examined the effects of varying soil layer resistivity and thicknesses on grid resistance for earthing systems installed in multilayer soils.
In conclusion, increasing the resistivity of soil layers tends to increase the earth grid system resistance, no matter which soil layer that is. This is linked to the reduced effectiveness of the earthing system to dissipate fault current into the soil.
On the other hand, increasing the thickness of soil layers will increase their relative impact on the grid resistance. For example, when the thickness of a layer with relatively high resistivity is increased the grid resistance will increase.
Note that the behaviour of earthing systems in multilayer soils is very different compared with uniform or 2-layer soils.
Références
[1] C. Hu, D. Wen, Y. Sun, Y. Wu, Y. Chen & L. Zhou, “Study on the Frequency Characteristics of Grounding Resistance in Non-uniform Soil Regions”, Preprints of the 5th international conference on Electric Utility Deregulation and Restructuring and Power Technologies, Novembre 2015, pp. 1752-1756.


